Use this program to:
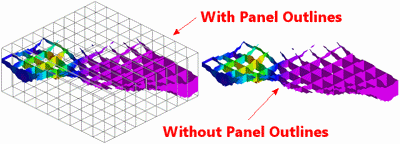
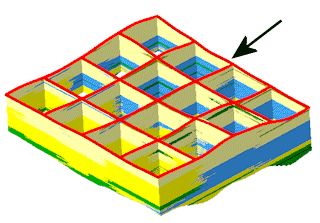
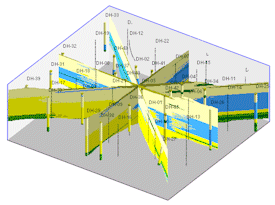
You may request regular panel spacing, in a variety of configurations, or you can draw your own panels. The lithologies will be represented in themodel using the numeric "G-values" declared in the Lithology Types Table. The lithologies will be represented in the diagram using the background colors defined for the patterns in the Lithology Types Table. 3D logs can be added to the image if desired. The completed fence diagram will be displayed in RockPlot3D.
Feature Level: RockWorks Standard and higher
Menu Options
Step-by-Step Summary
If you've selected Use Existing Model, the program will load the information from the existing lithology model (.RwMod file), and will proceed to diagram generation.
If you've selected Create New Model, the program will scan the project database and extract the borehole locations, lithology depths and materials, and any borehole orientation. It will apply any source data filters you have requested, and will interpolate the solid lithology model.
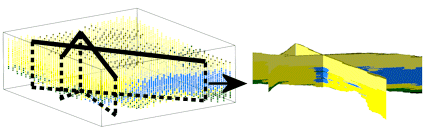
The program will look at the coordinates specified for each fence panel and determine the closest nodes along the cuts in the brand-new model, if created, or in the existing model. It will construct a vertical profile to illustrate the lithology types, using the rock types' background colors specified in the Lithology Types Table. This process will be repeated for each fence panel you drew. Logs will be appended if requested. The completed diagram will be displayed in a RockPlot3D tab if requested.
! * If the lithology model looks OK and you just need to adjust one of the diagram settings, you don't need to keep re-interpolating the model. Choose Use Existing Model and browse for the lithology .RwMOD file to be used for the fence.
![]() Back to Lithology Menu Summary
Back to Lithology Menu Summary
![]()