RockWorks | Utilities | Planes | XYZ & Dips -> Profile
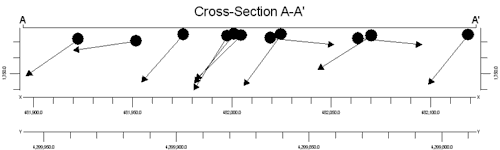
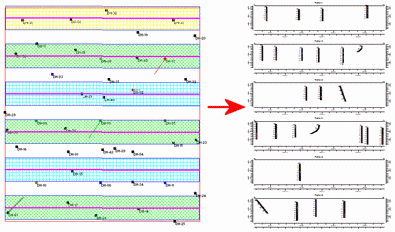
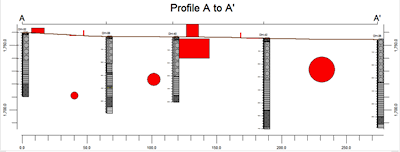
Use this program to read a list of XYZ points and planar orientations, and display the intersection of these planes along a profile "slice". The input data can be entered using the right-hand rule or as dip direction, dip angle.
Menu Options
Step-by-Step Summary
- Rules & Filters: Use the buttons at the top of the window to apply filters and rules for this program. (More info)
- Spatial Filter: Filter the input data based on XYZ location. This will also filter the data to be displayed in striplogs, if activated, based on spatial location.
- Time Filter: Filter any T-Data or Aquifer data in striplogs, if activated.
- Stratigraphic Rules: Apply stratigraphy rules for Stratigraphy data in striplogs, if activated.
- 2D Log Design
If you decide to include logs with this diagram ("Striplogs" setting, below), click on this button at the top of the window to set up how you want the 2D logs to look.
See Visible Item Summary and Using the 2D Log Designer for details.
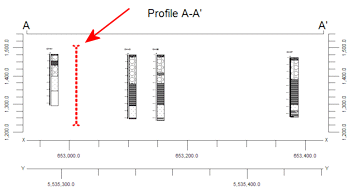
- Profile Location
Click on this tab to draw, on a map display of your enabled boreholes, where the profile cut is to be placed. The most recent profile drawn for this project will be displayed. (More info.)
! If you don't have boreholes in your project, there won't be any reference information in the selection map - just a rectangle defining the project dimensions. You may need to manually specify the panel coordinates
- Data Columns: These prompts tell RockWorks which columns in the current datasheet contain the input data.
Click on an existing name to select a different name from the drop-down list.
- Input
- X (Easting): Select the name of the datasheet column that contains the X coordinates for the measurement locations.
These can be Eastings in meters or feet, decimal longitudes, etc. See Defining your Datasheet Coordinates for more information.
- Y (Northing): Select the column that contains the Y coordinates for the points.
- Z (Elevation): Select the column containing the elevations for the locations. Be sure you have defined the vertical units (feet or meters) for the values. See Column Properties for information.
- Direction: Select the datasheet column that contains the strike bearing or dip direction.
! Be sure you correctly identify the input data type under Input Format, below.
- Dip: Select the column that lists the dip angle, in degrees, where 0 = horizontal and 90 = vertical, downward.
- Directionality: Choose how the planar data are recorded in the datasheet.
- Declination
- Magnetic Declination Correction: Enter any declinaton correction as described in the program dialog.
- Azimuths (Direction) Represent...
- Inclination (Dip) Direction: Choose this option if the Direction measurements, defined in the column above, represent planar dip direction.
- Strike Direction: Choose this option if the Direction measurements represent strike azimuth bearing. This assumes a right-hand rule whereby the dip direction is 90 degrees clockwise from the strike bearing.
- Vertical Exaggeration
Click here to pre-define the vertical stretch you would like to apply to your diagram. By giving the program this information in advance of generating the profile, it can help with text and graphic sizing and placement. (More info.)
- Appearance: Click this tab to set up the dip line appearance.
- Dip Line Plotting Options
- Line Length: Enter the length for the lines in your project units.
- Plot Line as Arrow: Check this to include an arrowhead at the line ending point.
- Plot Circle at Start: Check this to include a circle at the line starting point.
- Vertical Position At Start
- Based on Dip Z-Coordinate: Choose this option to place the line starting points at the input Z coordinate.
- Shift Vertically to Match Surface Model: Choose this option to place the line starting points at an elevation surface grid.
- Surface Grid Model: Click here to browse for the existing RockWorks grid model to be used.
- Annotation
Click on this tab to establish title, border, axis labels, and other perimeter settings for the profile. (More info.)
-
- Faults
Check this box if you want to display lines in the output diagram where the section slice intersects the fault(s) defined in a project Faults Table.
Click on this tab to set up the fault lines. (More info.)
-
- Clip
Check this box if you want to display a subset of the log data.
Click on the tab to define the elevation range to be displayed.
- Top Elevation: Enter the uppermost elevation to be displayed in the logs.
- Base Elevation: Enter the lowermost elevation to be displayed in the logs.
! Log clipping parameters are defined using elevations, not depths. (More info.)
- Parallel Profiles
Check this box if you want multiple profile lines to be drawn automatically, offset from the profile that you define.
Click on this tab to define the direction and spacing of the automatic profile lines, the maximum distance, and diagram labeling options. (More info.)
-
- Striplogs
Check this box to include 2D striplogs with your profile diagram. This requires that you have data entered into the Borehole Manager database.
Click on this tab to set up how you want the logs in the profile to look. (More info.)
- Infrastructure
Check this box to display buildings, pipes, or other infrastructure with your profile.
Click this tab to define the infrastructure file and plot settings. (More info)
-
- Location Map
Check this box to create, along with the profile, a reference map that shows the profile cut's location. It can be embedded in or created separately from the profile.
Click on this tab to establish the map options. (More info.)
-
- Other 2D Files
Check this option to include existing RockWorks profiles as layers with your profile.
Click on this tab to select the existing profiles (.Rw2D files) to be included. (More info)
- Peripherals
Check this option to include various peripheral annotations with your profile. Options include titles, text blocks, pattern legends, and more.
Click on this tab to activate the items and establish their settings. (More info)
- Border
Check this option to include a solid line border around the entire profile image.
Click on this tab to establish border settings.
- Output Options
- Save Output File: Check this to assign a name for the diagram in advance, rather than displaying it as Untitled.
-
- Automatic: Choose this option to have RockWorks assign the name automatically. It will use the name of the current program plus a numeric suffix, plus the ".Rw2D" file name extension.
- Manual: Choose this option to type in a name of your own for this file.
- Display Output: Check this option to have the resulting diagram displayed in RockPlot2D once it is created.
- Access the RockWorks Datasheet program tab.
- Create a new datasheet and enter/import your XYZ and direction and dip data into the datasheet.
Or, open one of the sample files and replace that data with your own. See Data Layout for datasheet examples.
! Click the Example button at the top of the window to load a sample file that is installed with the program.
- Choose the Utilities | Planes | XYZ & Dips -> Profile menu option.
- Enter the requested program settings, described above.
- Click the Continue button to proceed.
The program will look at the coordinates specified for the profile cut and determine the intersection with the planes defined in the datasheet. It will construct a vertical profile to illustrate the intersections using the line settings you established. The completed diagram will be displayed in a RockPlot2D tab in the Options window if requested.
- You can adjust any of the profile options and then click the Continue button again to regenerate the profile.
- View / save / manipulate / print / export the profile in the RockPlot2D window.
 Back to Planes Menu Summary

RockWare home page