RockWorks | ModOps | Solid | Display as Isoshells
This program is used to:
- Read an existing RockWorks solid model (.RwMod file), and
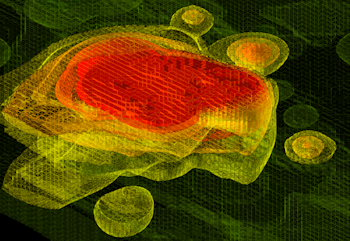
- Create a 3-dimensional isosurface diagram with up to 6 nested levels.
! See the ModOps | Solid | Create menu for creating a solid model from XYZG data, images, and other input. Or see the Borehole Manager's Lithology, I-Data, T-Data, P-Data, Fracture, Color, and Vector programs for creating solid models from borehole data.
See also
The Solid | Display program to display an existing model as voxels or an isosurface.
The Animate | Solids -> 3D Isoshell Animation program to generate an isoshell animation.
Feature Level: RockWorks Basic and higher
Menu Options
Step-by-Step Summary
- Rules & Filters: Use the buttons at the top of the window to apply filters and rules for this program. (More info)
- Spatial Filter: Filter the input data to be displayed in striplogs, if activated.
- Time Filter: Filter any T-Data or Aquifer data in striplogs, if activated.
- Stratigraphic Rules: Apply stratigraphy rules for Stratigraphy data in striplogs, if activated.
- 3D Log Design
If you decide to include logs with this diagram ("Striplogs" setting, below), click on this button at the top of the window to set up how you want the 3D logs to look.
See Visible Item Summary and Using the 3D Log Designer for details.
- Data Columns: Use these prompts to define the columns in the RockWorks Datasheet that list the XYZ(G) data from which the solid model was interpolated.
! These input prompts will be used ONLY IF you activate the Points layer in the diagram settings (see below). These settings will be ignored if you do not turn on the Points layer.
- X (Easting), Y (Northing), Z (Elevation): Choose the datasheet columns where these input data are stored. These define the 3D location of the sample points.
- Solid Name: Click to the right to browse for the name of the existing solid model (.RwMod file) you wish to display.
- 3D Solid Diagram
Click this tab to set up the diagram options.
- Thresholds: Use this table to define the different levels at which isosurfaces will be generated in the output display. List the highest cutoff value at the top (the smallest isosurface), and the lowest cutoff at the bottom (largest isosurface). You can enter up to 6 thresholds, for 6 different isolevels within the model.
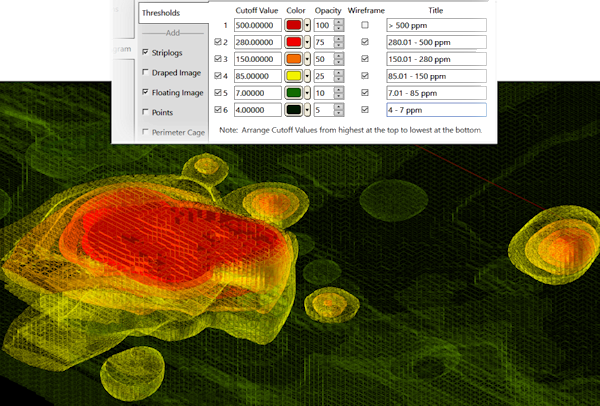
- Cutoff Value: Enter the value in the input solid model at which the isosurface "skin" is to be drawn.
- Color: Choose a color for that isolevel.
- Opacity: Set the opacity for that isolevel. Be sure to set the isolevels at the bottom of the table to < 100% opacity so that the smaller isosurfaces inside will be visible in RockPlot3D.
- Wireframe: Check this box if that isolevel is to be drawn as a wireframe rather than as a solid skin.
- Title: Enter a title for each isolevel. This will be used to label the item in the RockPlot3D data tree.
- Striplogs: Check this item to include 3D logs with the isosurface display. Click the 3D Log Design button at the top of the window to set up how you want the logs to look.
- XYZ Clipping: Check this sub-item if you want to restrict the logs to a particular spatial area. (More info)
- Other 3D Solid Diagram Options: Use these checkboxes to append other layers to your 3D scene. (Summary)
- Draped Image: Include an image in this 3D scene, draped over an existing grid surface. (More info)
- Floating Image: Include an image in this 3D scene, floating at a specified elevation. (More info)
- Perimeter Cage Include a 3D reference cage around the solid diagram. (More info)
- Legends: Include one or more legends with the diagram.(More info)
- Infrastructure: Display buildings, pipes, or other infrastructure with your 3D scene. (More info)
- Faults: Include 3D fault ribbons with this scene. (More info)
- Other 3D Files: Include other, existing, RockPlot3D ".Rw3D" files in this scene. (More info)
- Output Options: Use these settings to define whether the output scene is to be saved (or displayed as "untitled"), how the file should be named, and whether it is to be displayed after it is created. It also offers export options. (More info)
- Select the ModOps | Solid | Display as Isoshells menu option.
- Enter the requested menu settings, described above.
- Click the Continue button to proceed.
RockWorks will load the information from the existing model (.RwMod file), and generate the requested 3D diagram.
- You can adjust any of the diagram settings in the main Options tab to the left and then click the Continue button again to regenerate the display.
- View / save / manipulate / print / export the model in the RockPlot3D window.
 Back to Solid Menu Summary

RockWare home page