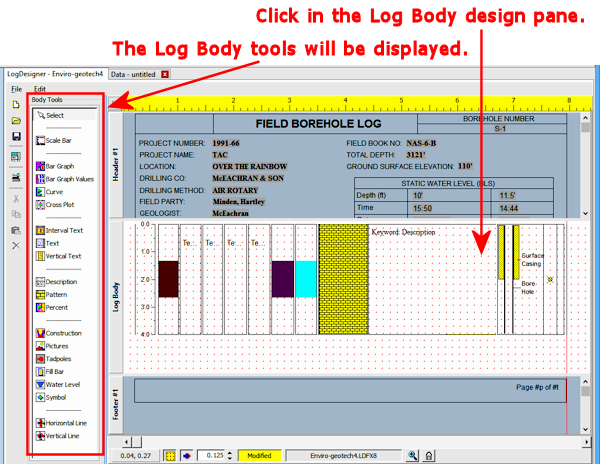
Here is a summary of the items that you can include in the body of your log. The tool buttons are found on the Log Designer tool pane, to the left of the program window, and can also be accessed in the Tools menu. These items are discussed in the remainder of this section.
| Click on items in the log design, to select / move / edit them. | |
| Plots depth or elevation labels down the log. | |
| Plots interval-based quantitative data as a bar graph. | |
| Plots value labels next to/overlaying a Bar Graph column. | |
| Plots quantitative data as a point-to-point curve (line, symbol, filled, block, etc.) | |
| Plots two sets of curve data, with overlapped regions filled with pattern and/or color. | |
| Displays text, defined within a depth interval, within the column. Text can be centered within the interval, with intervals bounded by borders. | |
| Plots text that is not associated with a lithologic pattern. This could include sample numbers, soil classifications, general comments, etc. | |
| Plots text vertically in the body of the log, between user-declared depths. This is commonly used to indicate stratigraphic or geologic age groupings | |
| Contains textual descriptions that are listed in your data file on a Lithology tab. The patterns for the declared description keywords will be plotted in the associated Lithology Pattern Column, if any. | |
| Contains graphic patterns that are associated with lithology keyword declarations. The column would typically represent lithology type, but could also contain mineralization, fossilization, and other patterns. | |
| Displays up to 20 lithology patterns in a column, based on component percentages. | |
| Illustrates the structure of the well construction materials in the body of the log. | |
| Plots raster images (BMP, TIFF, JPG, WMF, EMF, PCX, PNG, TGA) pictures in the body of the log. | |
| Displays structural readings (azimuth and dip) with tadpole symbols in the body of the log. | |
| Displays fractures projected onto the plane of the log as oriented lines. | |
| Fills user-declared intervals with a specific pattern, often used to note core samples or qualitative information ("good porosity", etc.). | |
| Plots a water level symbol and/or pattern bar at a specified depth and/or depth range, for selected dates. | |
| Plots user-selected symbols at specified depths, often used to note sample locations, tests, etc. | |
| Plots horizontal lines across a portion of or the entire log, at user-declared depths and/or at regular depth intervals. | |
| The Line button is used simply to plot a vertical line anywhere on the body of the log. |
![]() Back to Log Body Introduction
Back to Log Body Introduction
![]()