![]()
How it's Used
How to Insert a Symbol Column into a Log Design
Menu Settings
How to Review the Settings
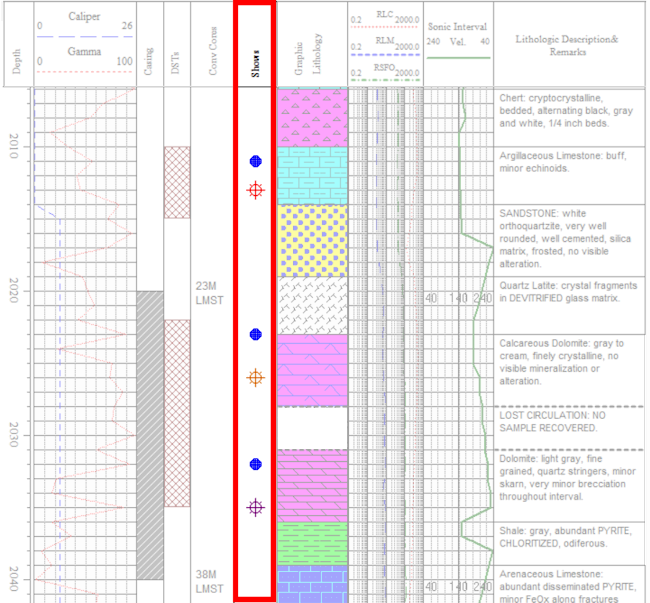
How it's used: A Symbol column is used to plot a specific symbol at user-declared depths. LogPlot can plot vector symbols or bitmap symbols. These can be used to note gas shows, sample locations, water levels, and more.
How it works: As you compile your log in LogPlot, the program will locate a depth point or interval in a Symbol datasheet or Point Symbol datasheet. It will plot the user-specified symbol at the declared depth in the Symbol Column of the same name. Each Symbol column on the log must have a separate tab in the LogPlot data file.
! Tip: You can place a Symbol column right on top of another log design entity, such as a Scale Bar to show drill stem tests or a Well Construction column to show water level.
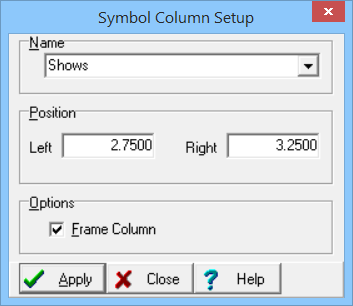
Name: Enter the name for this Symbol column. Any data in the LogPlot data file that is flagged with the same name will be plotted in this Symbol column.
Position: These coordinates determine the horizontal placement of the Symbol column in the body of the log. The horizontal coordinates are expressed in decimal inches or centimeters relative to the left edge of the design screen. You may change the column's position by editing these values, or by widening/narrowing the column itself on the work screen (see Moving and Resizing Log Body Components). Note that the size of the symbols plotted into the Symbol column is determined by size declarations in the data file.
Frame Column: If this box is checked, the column will be bounded by a solid-line rectangle.
If you need to access the Options window you can:
![]() Back to Log Body Item Summary
Back to Log Body Item Summary
![]()