
How it's Used
How to Insert a Bar Graph Column into a Log Design
Menu Settings
Bar Graph Name, Position, and Scaling
Bar Graph Appearance
Bar Graph Grid lines (Value and Depth)
A Bar Graph Column is used to plot quantitative data as scaled bars over depth intervals.
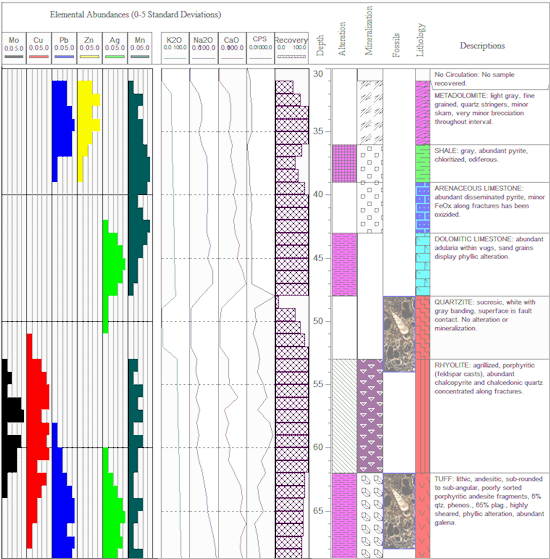
How it works: As you compile your log in LogPlot, the program will locate data in columns in Interval Data or Time Data datasheets, and it will plot the measurements in the Bar Graph column of the same name. The data may be plotted from left to right or right to left, linear or logarithmic scale, with or without horizontal or vertical reference grids. You may vary the color and fill pattern for the bars.
Alternatives: If you wish to display the data values themselves (as text labels) you can do so using a Bar Graph Value column or an Interval Text column.
See also: Header Curve and Bargraph Legends for column headings you can link to a bargraph column.
![]() Back to Log Body Item Summary
Back to Log Body Item Summary
![]()