![]()
How it's Used
How to Insert a Curve Column into a Log Design
Menu Settings
Curve name, position, and scaling
Curve appearance
Curve grid lines (value and depth)
Automatic Value Labels
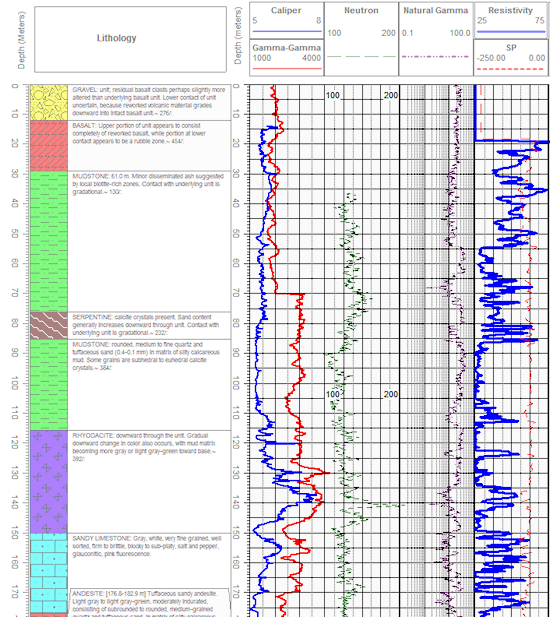
A Curve Column is used to plot quantitative data as a point-to-point curve. LogPlot offers a variety of ways to display this curve -filled, with symbols, as a block curve, etc.
How it works: As you compile your log in LogPlot, the program will locate data listed in a column in a Point Data datasheet, and will plot the data in the Curve Column of the same name. For example, data listed in a Point Data datasheet in a column named "Gamma" would plot into a curve column also named "Gamma".
Other Curve column features:
Alternatives: Columns in which two curves are displayed, with solid-fill color where they overlap are designed with the Cross Plot Curves column.
See also: Header Curve and Bargraph Legends for column headings you can link to a curve column.
![]() Back to Log Body Item Summary
Back to Log Body Item Summary
![]()