![]()
How it's Used
How to Insert a Well Construction Column into a Log Design
Menu Settings
How to Review the Settings
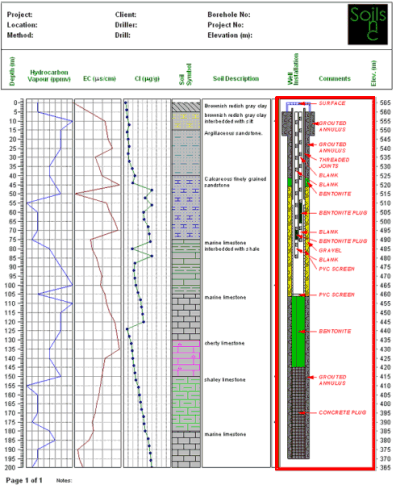
How it's used: A Well Construction column is used to illustrate the materials and intervals used in the construction of the well using graphic pattern blocks. You can plot captions as an integral part of the well construction diagram.
How it works: As you compile your log in LogPlot, the program will locate any Well Construction datasheets and read the declared material names (entered as "keywords," just like lithology) and their inner and outer diameter measurements. If LogPlot finds a Well Construction column in the design of the same name, it will plot the appropriate pattern for each material over the declared depth interval, at the declared width in the column. If requested, text captions for the materials will be plotted in a portion of the diagram. Each Well Construction column on the log must have a separate Well Construction datasheet in the data file.

Name: Enter the name for this Well Construction column. As you compile your log, if LogPlot finds a Well Construction datasheet with the same name, it will plot pattern-filled intervals representing the construction materials in that Column on the log.
Position: These coordinates determine the horizontal placement of the Well Construction column in the body of the log. The horizontal coordinates are expressed in decimal inches or centimeters relative to the left edge of the design screen. You may change the column's position by editing these values, or by widening/narrowing the column itself on the work screen.
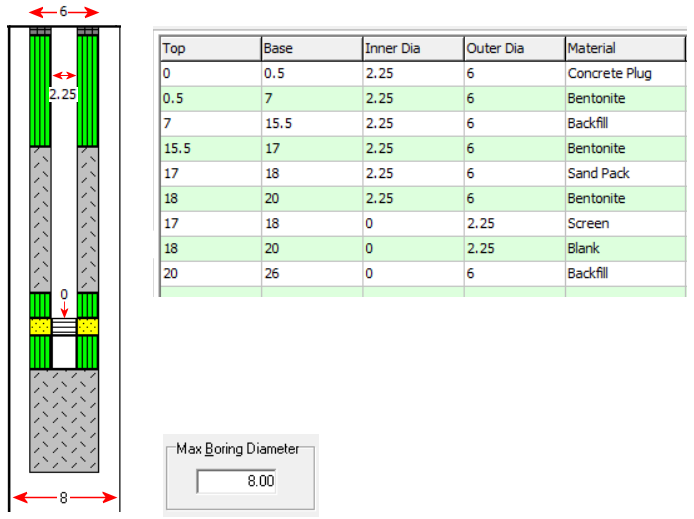
Maximum Boring Diameter: Enter here the real diameter of the drill hole, in any units you wish. An entry of "12," for example, could represent 12 inches. Or an entry of "30" could represent 30 centimeters.
This setting will not affect the actual width of the column on the log (you adjust that yourself just like all of the other log body columns). It will determine the width of the casing, screens, and other intervals that will be plotted within the column. These items are all listed within the data file with outer and inner diameter measurements, relative to this Maximum Boring Diameter.
Margin: Use this setting to define the margin between the captions (see below) and the diagram.
Border Around Column: Insert a check in this box if you want the Well Construction column to include a solid-line border.

Plot Labels: Insert a check here to plot any captions that you've listed in the data file, in a column to the right of the graphic diagram. Use the Font button and color box to define the font style and color for the captions. See the Well Construction datasheet for information about how the caption text is entered.
Diagram <-> Caption: Use this slider bar to define how much of the well construction column is to be used by the diagram and how much is to be used by the captions, as a percent. Some examples are shown below, though you should note that you can define other percentages than those shown here just by dragging the slider bar.

Plot Leader Lines: Insert a check here to include lines between the captions and the construction item. Click on the line sample below this prompt to select the line style and color for the leaders.
Arrows: Insert a check here to include an arrow head on the leader line. It will be plotted in the same color as defined for the line.
If you need to access the Options window you can:
![]() Back to Log Body Item Summary
Back to Log Body Item Summary
![]()