![]()
How it's Used
How to Insert a Bar Graph Value Column into a Log Design
Menu Settings
How to Review the Settings
A Bar Graph Value column is used to plot text labels representing data values, usually in association with a Bar Graph column.
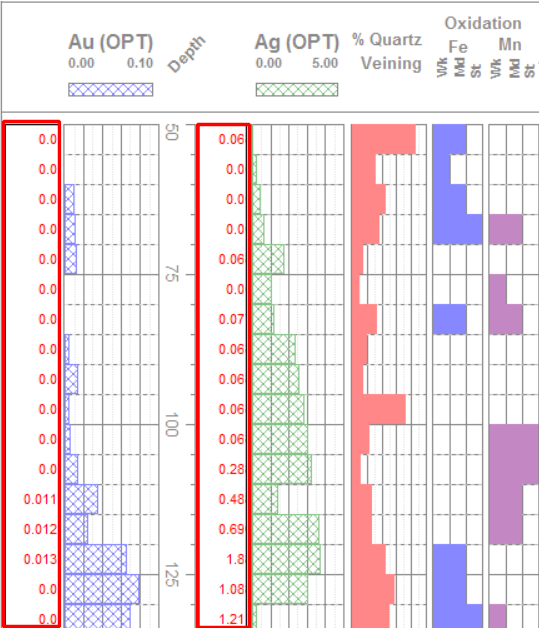
How it works: As you compile your log in LogPlot, the program will locate data in columns in Interval Data or Time Data datasheets, and it will plot the numeric values as textual labels in the Bar Graph value column of the same name. This can pull values from the same datasheet as an associated Bar Graph column. The labels may be left or right-justified, opaque or transparent.
Alternatives: If you wish to display the values in a graphic manner, you can use a Bar Graph column. The Interval Text column behaves similarly to this Bar Graph Value column, with additional formatting options.
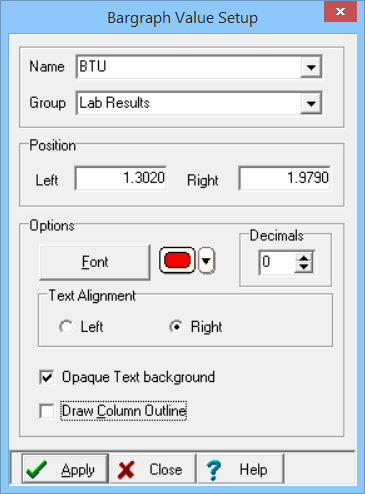
Name: Click on this drop-down list to select the name of the existing Bar Graph column in the design to which this textual column is to be associated. (This will also be the name of an Interval Data or Time Data column in the data file.) If none exists, you can type in a name.
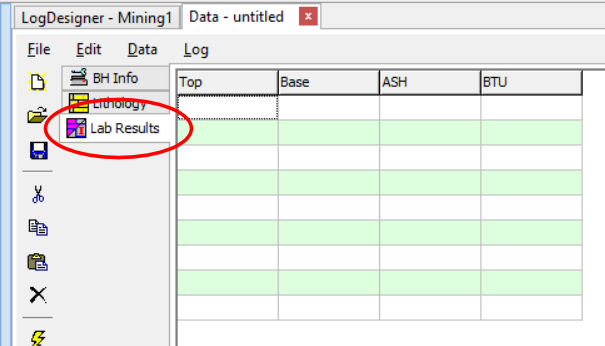
Group: The Group setting is only used when you create a new data file using this log design. With a Group name defined, multiple bargraph columns will link to a single Interval Data datasheet rather than separate sheets. The Group name defines the name of the tab.
Position: These coordinates determine the horizontal placement of the Bar Graph Value column in the body of the log. The horizontal coordinates are expressed in decimal inches or centimeters relative to the left edge of the design screen. You may change the column's position by editing these values, or by widening/narrowing the column itself on the work screen (see Moving and Resizing Log Body Components).
! This Bar Graph Value column can overlay a Bar Graph column if desired.
Font: Click on this button to access font type, style, size, and color for the value labels. If, after you compile your data for this log design within LogPlot, you find that the description characters are too large or too small for the given log scale, you may adjust the text font and size via these dialog box items.
Color: Use this button to select a color for the text. This may also be selected using the Font button, above.
Decimals: Click on the up- or down-arrow as necessary to set the number of decimal places for the value labels. Think about this one - if the bargraph values are small, be sure to set an adequate number of decimal places. Similarly, large integer values won't require any decimal places.
Alignment: Choose Left to align the first characters of the value labels along the left edge of the column, defined above. Or, choose Right to align the last character of each label along the right edge of the column, also defined above.
Opaque Text Background: Insert a check here if the labels are to block out any background items, or leave this blank to leave the text "transparent" so that any background items are still visible.
Draw column outline: Insert a check here if you want the Bar Graph Value column to be bounded by a solid-line rectangle. If this column is overlaying another column that already has a frame, you may wish to disable this outline.
If you need to access the Options window you can:
![]() Back to Log Body Item Summary
Back to Log Body Item Summary
![]()