![]()
How it's Used
How to Insert a Scale Bar into a Log Design
Menu Settings
How to Review the Settings
A Scale Bar is used to note measured depths, true vertical depths, or elevations down the log. You can insert multiple scale bars.
How it works: If the Scale Bar is set to Depths, the values on the depth bar will represent measured depths, starting at the uppermost depth represented in the log (rounded to labeling increments) and increasing downward in the log. The uppermost depth in the log is declared in the data file's BH Info datasheet and confirmed/updated in the Compile window.
If the Scale Bar is set to Elevations, the uppermost value on the bar will represent the elevation (rounded to labeling increments) which corresponds to the starting depth of the log. The numbers will decrease downward in the log. The elevation at the top of the hole is defined in the data file's BH Info datasheet.
If your well is not vertical, you can set the Scale Bar to display true vertical depths or elevations downhole. This is done by linking the Scale Bar to an "Orientation" datasheet in the data file, which lists the downhole survey depths, orientations, and inclinations.
Bar Position: This determines the actual placement of the scale bar; enter or change the horizontal coordinate for the vertical line of the scale bar. The horizontal coordinates are expressed in decimal inches or centimeters relative to the left edge of the design screen. The placement of the depth/elevation labels relative to the bar is established in the Labels tab, discussed below.
Style: These settings set up what the labels on the scale bar will repesent.
Depth: Choose this if the labels on this scale bar are to represent measured depths below the start of the hole.
Elevation: Choose this option if the labels on this scale bar are to represent elevations, calculated using the measured depths and surface elevation in the data file.
Survey Based: Choose this option if your well is not vertical and you want the scale bar to be linked to the downhole survey data.
Elevation: Choose this option from the drop-down list for the scale bar labels to represent true elevation, based on the measured depths, downhole survey, and starting elevation.
Negative Depth: Choose this option from the list for the scale bar labels to represent true vertical depth below the start of the hole, given the measured depths and downhole survey. The depths will be shown as negative numbers.
Positive Depth: Select this option for the scale bar to represent true vertical depth below the start of the hole, given the measured depths and downhole survey. The depths will be shown as positive numbers.
Orientation datasheet name: Select the name of the Orientation datasheet to which the scale bar is to be linked.
Dip from Vertical: Choose this option if your downhole survey measurements are formatted such that 0 = straight down and 90 = horizontal.
Dip from Horizontal: Select this option if your downhole survey measurements are formatted such that 0 = horizontal, -90 = straight down, +90 = straight up. See the Orientation Datasheet for more information.
Hide Axis Line: Check this box if the actual vertical line of the scalebar is not to be displayed (with the assumption that you will include labels, discussed below).
Conversions:
Convert: Insert a check in this box if you want the scale bar to convert your depth or elevation units from feet to meters or from meters to feet.
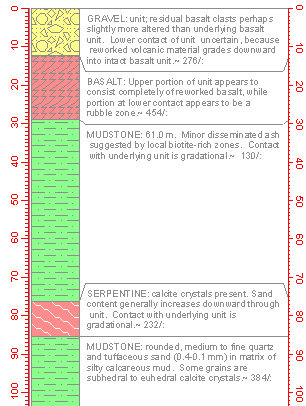
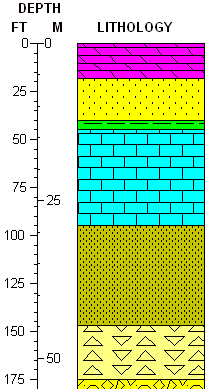
Example: Let's say your data units are feet. You could insert one Scale Bar in the log design with no conversion, and the units would represent feet. You could insert a different Scale Bar with a Feet to Meters conversion, and the labeled units would represent meters. An example is shown below.
Plot Labels: Check this box if you want labels plotted along with the tick marks.
Appearance:
Font: Click on this button to access font settings for the depth or elevation labels.
Color: Click on this box to select the font color. This can also be established in the Font settings, above.
Decimal Places: Enter the number of decimal places to be represented in each depth or elevation label.
Angle: Choose an angle for the labels by clicking in the appropriate radio button.
Position:
Left of Bar, Right of Bar, Both: Choose where the labels are to be placed relative to the scale bar line by clicking in the appropriate radio button. You should double-check how you set up the tick mark position (below) as well. (Label intervals are established on the Tick Marks tab, below.)
Adjust vertical position at top and bottom of page: If activated LogPlot will nudge the depth/elevation labels down or up slightly if they fall on a page break. This prevents the label from being clipped in half.
Major Tick Marks
Increment: Type in the depth or elevation interval at which the large tick marks should be plotted down the log in your downhole units or in the converted units if Convert is activated (Main tab).
! This will also be the interval for the depth/elevation labels; they are plotted with the major tick-marks.
Tick Size: Type into this prompt the size (length) for the major tick marks, in your design units (decimal inches or centimeters). The default is 0.1.
Style: Select the desired placement for the major tick marks using the displayed radio buttons. The placement of the labels is established separately on the Labels tab of the Scale Bar Options window (discussed above).
Minor Tick Marks
Increment: Type in the depth or elevation interval at which the small tick marks should be plotted down the log in your downhole units or in the converted units if Convert is activated (Main tab).
Tick Size: Type into this prompt the size (length) for the minor tick marks, in your design units (decimal inches or centimeters). The default is 0.05.
Style: Select the desired placement for the minor ticks using the displayed radio buttons.
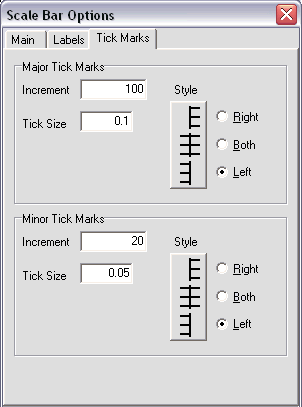
In this example, the Major ticks would be plotted every 100 units on the left side of the scale bar axis, and Minor ticks every 20 units. The scale bar labels would be plotted every 100 units with the Major tick marks.
If you need to access the Setup window you can:
![]() Back to Log Body Item Summary
Back to Log Body Item Summary
![]()