![]()
How it's Used
How to Insert a Crossplot Curves Column into a Log Design
Menu Settings
Crossplot Curve Position and Overplot Color
Crossplot Curves Names, Data Range, Scaling, Appearance
Crossplot Curves Grid lines (Value and Depth)
A Cross-Plot Curves column is a specialized type of curve-plotting column, in which two curves are displayed in the same column. Distinct colors can be selected for the curves themselves, and for the region where the curves cross.
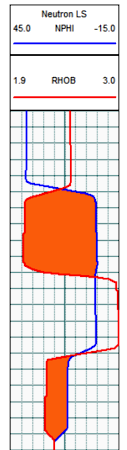
How it works: As you compile your log in LogPlot, the program will locate data listed in a column in a Point Data datasheet, flagged with the same names as the curves set up in the Cross-Plot Curves column, and plot those data values in the log. For example, data contained in Point Data datasheet columns named "NPHI" and "RHOB" would plot into Crossplot Curve columns also named "NPHI" and "RHOB".
Other Crossplot Curve column features:
Alternatives: Columns in which individual curves are displayed are designed with the Curve Column tool.
![]() Back to Log Body Item Summary
Back to Log Body Item Summary
![]()