Use the tools in the RockWorks | Utilities | Maps menu to read spatial data from the Datasheet, and generate a variety of different maps. This topic summarizes the tools that are available - click on a link or picture for more information.
![]() Back to Utilities Summary
Back to Utilities Summary
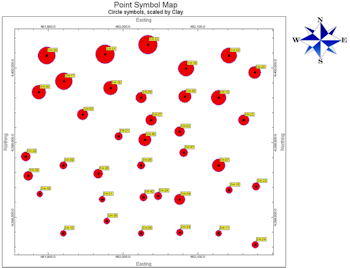
Point Symbols: Read XYZ data from the datasheet, create a map showing sample locations with uniform or variable symbols, labels, and other map layers. (More info)
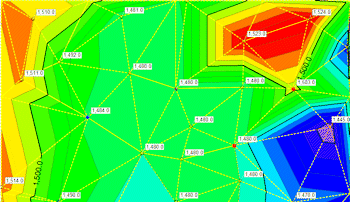
Triangulation Contours: Read XYZ data from the datasheet, create a map with Delaunay-triangulated line/color contours and other map layers. (More info)
Multi-Variate Maps: Create maps which illustrate multiple measurements at map points.
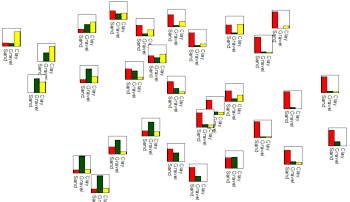
Barchart Maps: Illustrate the relative percentage multiple variables as varying-length bars at each sample location. (More info)
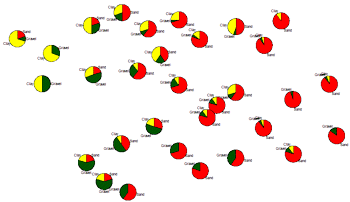
Piechart Maps: Illustrate the relative percentage of multiple variables as varying-width pie "slices" at each sample location. (More info)
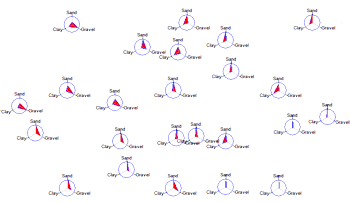
Spider Maps: Illustrate the relative percentage of multiple variables as polygons within a circle. (More info)
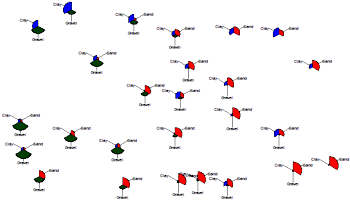
Starburst Maps: Illustrate the relative percentage of multiple variables as varying-length pie "slices" at each sample location. (More info)
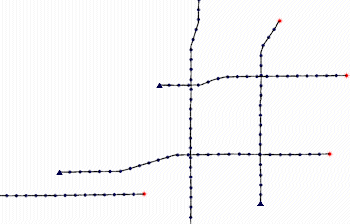
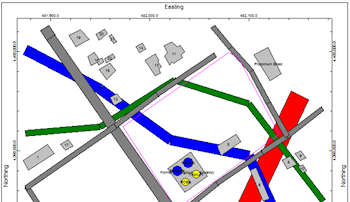
Infrastructure Maps: Read infrastructure objects and parameter settings from a text file and display them as a 2D map. (More info)
Line/Polyline/Polygon Maps: Create maps illustrating line segments, polylines, and polygons.
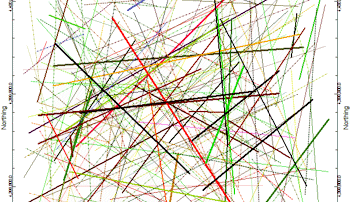
Lineation/Arrow Maps: Read line endpoint coordinates from the datasheet and create a map in which lineations are represented with using fixed or variable line styles, with optional arrowheads at the endpoints. (More info)
Seismic Shotpoints: Create maps which illustrate shotpoint locations as read from the datasheet. (More info)
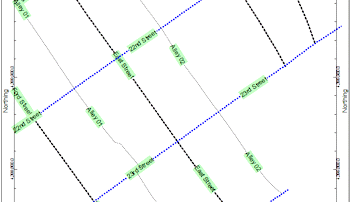
Polylines: Read vertex coordinates from a single file or multiple files, and create a map with the listed polyline(s). (More info.)
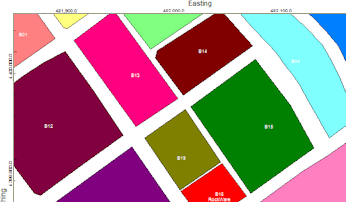
Polygons: Read vertex coordinates from a single file or multiple files, from a single project table or multiple project tables, and create a map with the listed polygon(s). (More info.)
Claim, Lease and Section Maps:
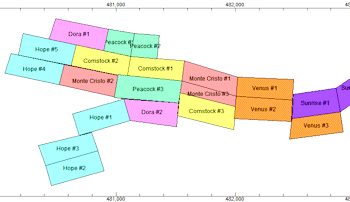
Mining Claims: Create a map displaying 4-cornered claim blocks. (More info)
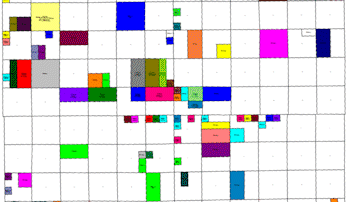
Lease Map: Read lease descriptions in a Range-Township-Section-quarter/quarter or lot format, and create a map illustrating lease block boundaries, filled with patterns and/or colors, based on the RockWare LandBase. (More info)
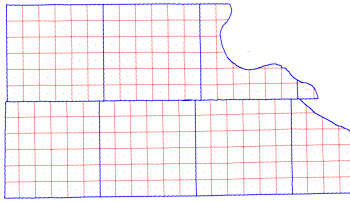
Section Map: Create a map of Range, Township, and Section boundaries, based on the RockWare LandBase. (More info)
![]() Back to Utilities Summary
Back to Utilities Summary
![]()