RockWorks | Utilities | Maps | Lineations/Arrows
Use this program to read a listing of XY point pairs from the RockWorks datasheet, and create a 2D map with a line segment drawn between these vertices, in a selected line style and color. Symbols can be included at either/both endpoints. Arrowheads can be plotted at the line endpoints.
Examples: Map lineations in your project area. Map well surface and TD locations with specific symbols, labels, and a connecting line.
Menu Options
Step-by-Step Summary
- Spatial Filter: Insert a check in this box at the top of the program window to activate a data filter based on spatial coordinates. Click this button to enter the filter settings. Click the Return to Previous Menu button when you are done entering the filter settings. (More info)
- Time Filter: Insert a check in this box at the top of the program window to filter the borehole Aquifer or T-Data based on date/time. This only applies to the Borehole Locations overylay layer, if activated. Click this button to enter the filter settings. Click the Return to Previous Menu button when you are done entering the filter settings. (More info)
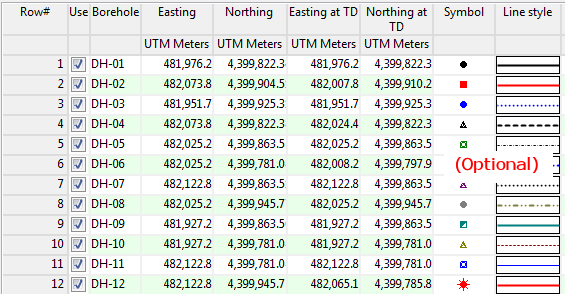
- XY Columns: These prompts tell RockWorks which columns in the input datasheet contain the required data.
Click on an existing name to select a different name from the drop-down list. See a sample data layout below.
- X1: Select the column in the main datasheet that contains the X or Easting coordinates for the starting point of the line.
These can be Eastings in meters or feet, decimal longitudes, etc. See Defining your Datasheet Coordinates for more information.
- Y1: Select the column that contains the Y or Northing coordinates for the starting point.
- X2: Select the column that contains the X coordinates for the ending point of the line.
- Y2: Select the column that contains the Y coordinates for the endpoint.
- Lineations: Click here to set up the line and symbol options.
- Line Style
- Fixed: Click this button for all of the lines to be plotted using the same line style. Click the box to the right to select the line style, thickness, and color.
- Defined by Column: Choose this option if you have line styles listed in the datasheet. Click on the column name displayed to the right to choose the name of the column where the lines are listed.
- Azimuth Filters: Check this option to activate one or two filters based on lineation bearing.
- Azimuth Filter #1: Check this item to omit lineations from the map based on their bearing. Here you will enter the bearing filter range for the lineations to be included in the map.
! The program will assume this is bi-directional.
- Tip: Use the Linears | Lineation Properties tool to compute and record the bearing of each lineation in the datasheet.
- Minimum, Maximum: Type in the minimum and maximum bearing (0 to 360) for the lineations to be included in the map.
- Azimuth Filter #2: If you wish to invoke a second filter, insert a check here and follow the instructions for the Filter #1, above, for lineations to be included in the map.
- Length Filters: Check this option to exclude lineations from the map based on their computed length.
- Tip: Use the Linears | Lineation Properties tool to compute and record the length of each lineation in the datasheet.
- Minimum: Insert a check here to activate a filter that will omit lines shorter than the length you specify. Type in the minimum length, in your map units.
- Maximum: Insert a check to activate a filter that will omit lines longer than the length you specify. Enter the maximum length, in your map units.
- Arrowheads: Check this option to include arrowheads at the line endpoints.
- Type: Choose either hollow or filled arrowheads.
- Size: Enter a size for the arrowhead, as a percent of your project extents. A value of "1.0" will create arrowheads that are approximately 1% of the width of the map.
- Point #1 Symbols: Check this option to plot uniform or unique symbols at the starting point of the lineations.
- Fixed: Choose this option to select a single symbol type for all points. Click to the right to choose the symbol design and color.
- Variable: Choose this option if the symbols are listed in the datasheet. Click to the right to choose the name of the column where the symbols are listed.
- Size: Type in the size for the symbol. The size is declared as a percent of the project extents.
- Point #2 Symbols: Check this option to plot uniform or unique symbols at the endpoint of the lineations. The same settings are offered, as above.
- Point #1 Labels: Check this option to include labels with the starting symbols. Expand this heading to access the settings.
- Fixed: Choose this to define a single label for each starting point. Click to the right to type in the label.
- Variable: Choose this option if the label text is listed in the datasheet. Click to the right to choose the name of the column where the label text is listed.
- Size: Type in the size for the labels. The size is declared as a percent of the project extents.
- Point #2 Labels: Check this option to include labels at the endpoint of the lineations. The same settings are offered, as above.
- Label Offsets: Use these settings to specify how point labels (if activated) are to be positioned.
- Automatic: This option allows the program to position the labels automatically, to prevent overplotting.
- Manual: This permits you to define a specific offset for the label from each symbol.
- X-Offset: Click to the right to enter the horizontal offset of the start of each label from each symbol, as a percent of the project size. Positive offset values will shift the label to the right, and negative values to the left.
- Y-Offset: Click to enter the vertical offset for the label from each symbol, as a percent of the project size. Positive offset values will shift the label upward and negative values downward.
- Map Layers: Select the layers you wish to incorporate into the map, inserting a check-mark in those you wish to include. Establish the settings for each activated layer, such as a background image, axis labels, etc. See 2D Map Layers for more information.
- Output Options
- Save Output File: Check this to assign a name for the map in advance, rather than displaying it as Untitled.
- Automatic: Choose this option to have RockWorks assign the name automatically. It will use the name of the current program plus a numeric suffix, plus the ".Rw2D" file name extension.
- Manual: Choose this option to type in a name of your own for this file.
- Display Output: Check this option to have the resulting map displayed in RockPlot2D once it is created.
- Access the RockWorks Datasheet program tab.
- Create a new datasheet and enter or import your X and Y coordinate pairs into the datasheet.
Or, open one of the sample files and replace that data with your own. See Data Layout for datasheet examples.
! Click the Example button at the top of the window to load a sample file that is installed with the program.
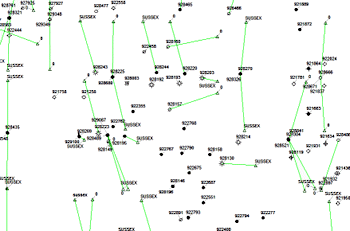
Here's an example of how this listing might look:
- Select the Utilities | Maps | Lineations/Arrows menu option.
- Establish the menu settings as described above.
- Click the Continue button to create the map.
The program will create the map with the selected symbols, labels, and lines, and display the map in a RockPlot2D tab in the Options window if requested.
- You can adjust any of the mapping options along the left and click the Continue button to regenerate the map.
- View / save / manipulate / print / export the map in the RockPlot2D window.
Tip: Use the Borehole Manager's File | Locations -> Datasheet program, with "Transfer the coordinates at Total Depth" activated, to get a row-and-column list of your borehole surface and TD locations. Then use this program to create a map with symbols at the borehole surface and TD, with lines connecting them to display the well trace.
 Back to Map Menu Summary

RockWare home page