RockWorks | Utilities | Maps | Oil Leases
Use this program to read lease descriptions in a Range-Township-Section-quarter/quarter or lot format, and create a map illustrating lease block boundaries, filled with patterns and/or colors, for output to RockPlot2D. The map coordinates will reflect the current Output Coordinates of your project. Use of this program requires installation of the free RockWare LandBase, via the Help | Downloads menu (RockWare LandBase Version 2).
See also:
Google Earth Lease Maps
Feature Level: RockWorks Basic and higher
Menu Options
Step-by-Step Summary
- Spatial Filter: Insert a check in this box at the top of the program window to activate a data filter based on spatial coordinates. Click this button to enter the filter settings. Click the Return to Previous Menu button when you are done entering the filter settings. (More info)
- Time Filter: Insert a check in this box at the top of the program window to filter the borehole Aquifer or T-Data based on date/time. This only applies to the Borehole Locations overylay layer, if activated. Click this button to enter the filter settings. Click the Return to Previous Menu button when you are done entering the filter settings. (More info)
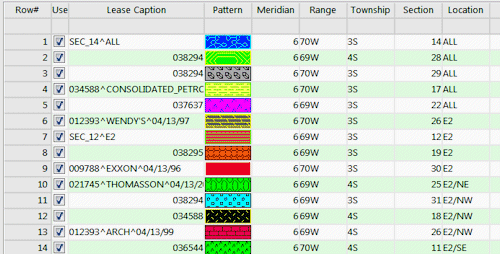
- Data Columns: Specify the input data columns by clicking on this tab.
- Title: Select the column that contains the lease name, if any.
- Pattern: Select the column that contains the pattern design for the lease. Under the menu settings, you can choose to plot the background color only, or omit any fill altogether.
- Meridian: Select the name of the datasheet column that contains the number of the Principal Meridian in which the Township is located. This is required in the event that a project spans more than one Meridian.
- Range: Select the name of the column in the datasheet that contain the Range numbers. Please see the Lease Data description for the required data layout.
- Township: Select the name of the column in the datasheet that contain the Township numbers.
- Section: Select the name of the column in the datasheet that contain the section numbers. These must be entered with the Section number (1 - 36) in which the lease is located.
- Legal: Select the name of the column in the datasheet that contain the location descriptions. The well locations can be listed in either quarter/quarter format or in footage listings.
- Lease Options
- Plot Titles: Insert a check here if you want the lease ID or caption field listed in the data sheet to be included as a label with the lease block.
- Text Size: Choose the size for the lease labels, as a percent of the dimensions of the lease area.
- Color: Click the color box to choose a color for the map text.
- Fill Polygons: Insert a check here if you want the lease blocks on the map to be filled with either patterns (as declared in the Pattern column in the data sheet) or with color (declared as the background color for the pattern in the data sheet). Choose Color Only or Patterns as you wish.
- Perimeter Line Style: Click here to choose a line style and color for the lease block outlines.
- Map Layers: Select the layers you wish to incorporate into the map, inserting a check-mark in those you wish to include. Establish the settings for each activated layer, such as a background image, axis labels, etc. See 2D Map Layers for more information.
Tip: Use the Map Overlays | US Public Land Grid layer to include the section lines with the lease map.
- Output Options: Use these settings to define whether the output graphic is to be saved (or displayed as "untitled"), how the file should be named, and whether it is to be displayed after it is created. It also offers export options. (More info)
- Access the RockWorks Datasheet program tab.
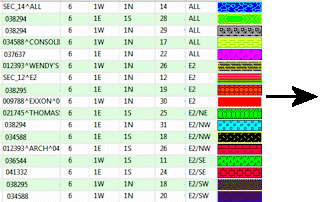
- Create a new datasheet and enter or import your lease data into the datasheet.
Or, open one of the sample files and replace that data with your own. See Data Layout for datasheet examples.
! Click the Example button at the top of the window to load a sample file that is installed with the program.
This example illustrates the sample file "\Documents\RockWorks Data\Samples\Maps_Oil_Leases.rwDat".
- Be sure you have downloaded the RockWare Landbase; the program will use this reference land grid to compute the corner coordinates for the lease blocks for mapping purposes.
- Select the Utilities | Maps | Oil Leases menu option.
- Enter the requested program settings as described above.
- Click the Continue button to continue.
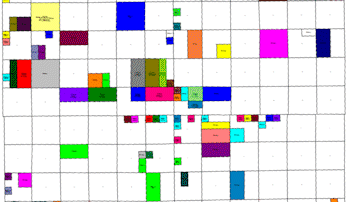
The program will read the PLSS description data from the current data sheet, compute the project coordinates for those lease corners using the RockWare LandBase, and create a map illustrating the lease blocks, with specified fill and labeling settings. The completed map will be displayed in a RockPlot2D tab in the Options window, if requested.
- You can adjust any of the settings via the Options tab to the left and then click the Continue button again to regenerate the lease map.
- View / save / manipulate / export / print the map in the RockPlot2D window.
 Back to Map Menu Summary

RockWare home page