RockWorks | Utilities | Maps | Polylines
Use this program to read a listing of XY points from the Datasheet Editor, or a listing of separate polyline files, each containing XY point coordinates, and create a 2D map with polyline(s) drawn between these vertices, in a selected line style and color. Smoothing, labels, symbols, and hatchures are available. The map is displayed in RockPlot2D, where you can append it to other maps, etc.
See also: Google Earth Polyline Maps for polyline maps output to Google Earth.
Menu Options
Step-by-Step Summary
- Spatial Filter: Insert a check in this box at the top of the program window to activate a data filter based on spatial coordinates. Click this button to enter the filter settings. Click the Return to Previous Menu button when you are done entering the filter settings. (More info)
- Time Filter: Insert a check in this box at the top of the program window to filter the borehole Aquifer or T-Data based on date/time. This only applies to the Borehole Locations overylay layer, if activated. Click this button to enter the filter settings. Click the Return to Previous Menu button when you are done entering the filter settings. (More info)
- Data Source: Define the input columns the program is to read. See below for examples of the Single and Multiple layouts.
- Datasheet - Single: Choose this if the input datasheet contains a single list of polyline vertices.
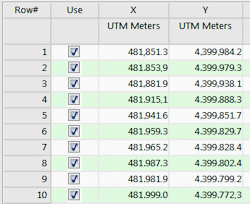
- Datasheet Input Columns: Select the names of the columns in the current datasheet which list the polyline vertices.
- X (Easting): Select the column in which the X coordinates for the polyline vertices.
These can be Eastings in meters or feet, decimal longitudes, etc. See Defining your Datasheet Coordinates for more information.
- Y (Northing): Select the column that contains the Y coordinates for the polyline vertices.
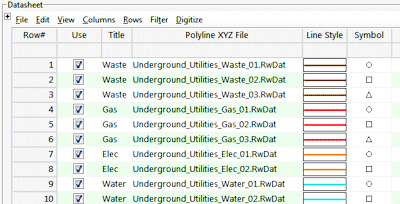
- Datasheet - Multiple: Choose this option if the input datasheet contains a list of names of individual RwDat files, each of which contains a list of polyline vertices.
- Datasheet Input Columns: Select the names of the columns in the current datasheet which list the polyline names and input files.
- Title: Select the column in which the names for the polylines are listed.
- File: Select the column that contains the names of the external .rwDat files containing the polyline vertices.
Tip: use the File | Import | Create File List program to quickly create a list of specified file names.
- Line Style:
- Fixed: Choose the line style and color for the single polyline. Or, if you are plotting multiple polylines, choose Fixed if all are to be plotted using the same style and color that you select here.
- Variable: Choose this option for each polyline to be plotted using the line style and color listed in the datasheet.
- Line Style and Color Column: Click to select the name of the column that contains the line type/color.
- Smoothing Factor: Enter 0 for no smoothing, 1 for slight smoothing, 2 for more smoothing.
- Add Labels: Insert a check here to include labels along the length of the polyline, like a contour label.
- Label: Type in the text to be shown as the label. (Single-file input only.) If you are inputting multiple files, the labels will be pulled from the Title column, defined above.
- Color: Click to the right to choose a color for the label text.
- Size: Define the size for the label text, as a percent of the project extents.
- Spacing: Type in the spacing of the labels along the polyline, as a percent of the map width. The greater the value, the fewer the labels (the wider the spacing of the labels).
- Opaque Background: Check this box to plot the labels against a colored background. Click on the color box to choose the color.
- Add Symbols: Insert a check here to include symbols along the length of the polyline.
- Type of Symbol: Choose the type of symbol by clicking in the appropriate radio button.
- Symbol Size: Type in a size for the symbol, as a percent of the project size.
- Symbol Spacing: Type in the spacing for the symbols along the polyline as a percent of the project size.
- Map Layers: Select the layers you wish to incorporate into the map, inserting a check-mark in those you wish to include. Establish the settings for each activated layer, such as a background image, axis labels, etc. See 2D Map Layers for more information.
- Output Options
- Save Output File: Check this to assign a name for the map in advance, rather than displaying it as Untitled.
- Automatic: Choose this option to have RockWorks assign the name automatically. It will use the name of the current program plus a numeric suffix, plus the ".Rw2D" file name extension.
- Manual: Choose this option to type in a name of your own for this file.
- Display Output: Check this option to have the resulting map displayed in RockPlot2D once it is created.
- Access the RockWorks Datasheet program tab.
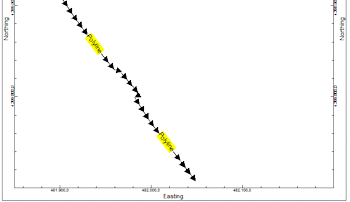
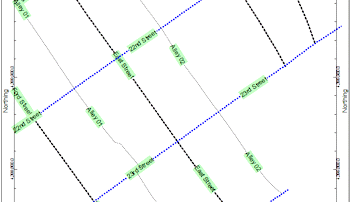
- Create a new datasheet and enter or import your X and Y coordinates into the datasheet (single polylines, like the example on the left below) or the names and titles of the separate polyline data files (multiple polylines, as shown on the right below).
Or, open one of the sample files and replace that data with your own.
Longitude and latitude coordinates must be in decimal format. If you're using another coordinate system, be sure you've specified the Units and the Projection Settings as appropriate.
! Click the Example button at the top of the window to load a sample file that is installed with the program.
- Select the Utilieis | Maps | Polylines menu option.
- Enter the menu settings as described above.
- Click the Continue button to continue.
The program will construct line segments between the coordinate pairs in the current datasheet or in the linked datasheets, in the line color, style, and thickness you specified, with the smoothing, label, and symbol embellishments you've selected. The completed map will be displayed in a RockPlot2D tab in the Options window, if reqeusted.
- You can adjust any of the settings in the Options window and then click the Continue button again to regenerate the map.
- View / save / manipulate / export / print the map in the RockPlot2D window.
 Back to Map Menu Summary

RockWare home page