RockWorks | Utilities | Maps | Land Grid
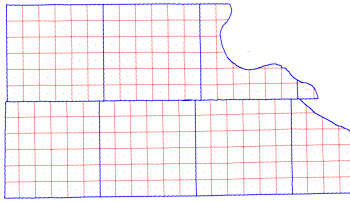
Use this program to create Range/Township/Section maps, which illustrate Jeffersonian land grid boundaries (Public Land Survey System), for output to RockPlot2D. Use of this program requires installation of the free RockWare LandBase, via the Help | Download | Misc Downloads menu (RockWare LandBase Version 2).
See also:
Google Earth Section Maps
Feature Level: RockWorks Basic and higher
Menu Options
Step-by-Step Summary
- Spatial Filter: Insert a check in this box at the top of the program window to activate a data filter based on spatial coordinates. This only applies to the Borehole Locations overylay layer, if activated. Click this button to enter the filter settings. Click the Return to Previous Menu button when you are done entering the filter settings. (More info)
- Time Filter: Insert a check in this box at the top of the program window to filter the borehole Aquifer or T-Data based on date/time. This only applies to the Borehole Locations overylay layer, if activated. Click this button to enter the filter settings. Click the Return to Previous Menu button when you are done entering the filter settings. (More info)
- PLSS Options
- Extent: Click here to define how the land grid map extents will be defined.
- Project Dimensions: (Slow) Click in this radio button to create a section map for the entirety of your project, across the coordinate extents established in the Project Dimensions tab.
! Because this option requires that the program scan the entire LandBase library, this can be very slow.
- Longitude & Latitude: (Slow) Click in this radio button, and click on the tab, to enter the longitude and latitude coordinates, in decimal degrees, for the map edges.
! Because this option requires that the program scan the entire LandBase library, this can be very slow.
- Western Border (Min Longitude): Click to the right to type in the decimal longitude coordinate for the western edge of the section map.
- Eastern Border (Max Longitude): Click to the right to type in the decimal longitude coordinate for the eastern edge of the section map.
- Southern Border (Min Latitude): Click to the right to type in the decimal latitude coordinate for the southern edge of the section map.
- Northern Border (Max Latitude): Click to the right to type in the decimal latitude coordinate for the northern edge of the section map.
- Range & Township: (Fast) Click in this radio button, and click on this tab, to to create the section map for a specific Range and Township listing. Partial Townships are not allowed.
- Principal Meridian: Click on this button at the top of the pane to view a map of the U.S. Select the BLM zone in which you are working by clicking in the appropriate radio button. This setting is important in order to define the correct placement of the Range and Township data.
- Ranges: Type in the western-most and eastern-most ranges to be included in the map.
! Refer to the interactive Principal Meridian map (above) to see what Ranges are available for the selected area. You can hover your mouse over each Meridian button to see the Ranges and Townships included.
- Westernmost Range: Click here to type in the number for the westernmost Range to be included in the map. You need to be sure to enter a number and a letter, as in "6W" or "R6W", or as in "3E" or R3E". You can also note western Ranges simply with a negative sign, as in "-6" and eastern Ranges with a positive sign, as in "3"
- Easternmost Range: Click here to type in the number for the easternmost Range to be included in the map. As above, you need to enter a number and a letter, as in ""6W" or "R6W", or as in "3E" or R3E". You can also note western Ranges simply with a negative sign, as in "-6" and eastern Ranges with a positive sign, as in "3.0"
- Townships: Type in the Townships to be included in the map.
- Southernmost Township: Click here to type in the number for the southernmost Township to be included in the map. You need to be sure to enter a number and a letter, as in "13S" or "T13S", or as in "5N" or T5N". You can also note Southern Townships simply with a negative sign, as in "-13" and Northern Townships with a positive sign, as in "5"
- Northernmost Township: Click here to type in the number for the northernmost Township to be included in the map. As above, you need to enter a number and a letter, as in "13S" or "T13S", or as in "5N" or T5N". You can also note southern Townships simply with a negative sign, as in "-13" and northern Townships with a positive sign, as in "5".
- Clip to Project Dimensions: Check this box to crop your Range and Township map to the boundaries of your project, as defined in the Project Dimensions pane at the top of the program window.
- Map Options: Use these settings to define how the section map will look.
- Section Borders: Insert a check here to plot section lines in the map to represent the boundaries of each map Section.
- Line Style + Color: Click to the right to select a line style and color for the section boundary lines.
- Fill Sections: Check this box to fill the section polygons with a solid color fill. Click on this tab to establish the fill options.
- Color:
- Fixed: Choose this for uniform fill. Click the color box to choose the fill color.
- Random: Choose this option to have RockWorks randomly select fill colors.
- Opacity: Click to the right to type in an opacity percentage. Examples: "20" will be 20% opaque (80% transparent); "75" will be 75% opaque, 25% transparent.
- Section Labels: Check this box to include map labels inside each Section to represent the Section number. Click on this tab to establish label settings.
- Verbose: If checked, each Section label will also include Range and Township number. If not checked, only the Section number will display.
-
- Include Acreages: If checked, the computed acreage values will be listed in the labels below the Section number.
- Font Size: This establishes the size of the Section labels, as a percent of the diagonal size of the section.
- Font Color: Click to choose the Section label color.
- Opaque Background: Check this box for the section labels to be plotted against an opaque background, and select the background color.
- Township Borders: Check this box to include lines to represent the boundaries of each map Township. If the map includes only a single Township, then the selected border will represent the perimeter of the entire map.
- Line Style + Color: Click to the right to choose the line style and color for the Township borders.
- Fill Townships: Check this box to fill the township polygons with a solid color fill. Click this tab to establish the fill options.
- Color:
- Fixed: Choose this for uniform fill for all polygons. Click the color box to choose the fill color.
- Random: Choose this option to have RockWorks randomly select fill colors.
- Opacity: Click to the right to type in an opacity percentage. Examples: "20" will be 20% opaque (80% transparent); "75" will be 75% opaque, 25% transparent.
- Township Labels: Check this box to include map labels that will be plotted inside each Township and will represent the Range and Township number.
- Verbose: Check this box if the Township labels should contain "R" and "T" in addition to the numbers and directions.
-
- Font Size: This establishes the size of the Township labels, as a percent of the diagonal size of the Township.
- Font Color: Click to choose the Township label color.
- Opaque Background: Check this box for the Township labels to be plotted against an opaque background, and select the background color.
- Labeling Convention: Click in the appropriate button to determine whether the Range or Township is listed first.
- 2D Map Layers
- Insert a check in any of the other map layers which are available to include them with your section map. Click on their tab to establish the map settings. See 2D Map Layers for more information.
- Output Options: Use these settings to define whether the output graphic is to be saved (or displayed as "untitled"), how the file should be named, and whether it is to be displayed after it is created. It also offers export options. (More info)
- Be sure you have downloaded the 8 landbase files using the Help | Download | Misc Downloads option (choose the RockWare Landbase Version 2).
- Select the Utilities | Maps | Land Grid menu option.
- Enter the requested program settings, described above.
- Click the Continue button to proceed.
The program will create a map illustrating the Township, Range, and Section data listed in the RockWare Landbase, using the mapping settings you requested. The completed map will be displayed in a RockPlot2D tab in the Options window, if requested.
- You can adjust any of the settings via the Options tab to the left and then click the Continue button again to regenerate the section map.
- View / save / manipulate / export / print the map in the RockPlot2D window.
 Back to Map Menu Summary

RockWare home page