RockWorks | Utilities | Maps | Seismic Shotpoints
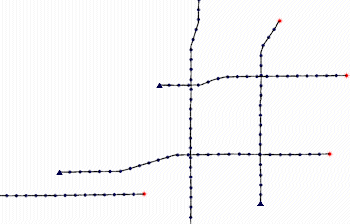
This program is used to create a map that illustrates shotpoint locations as read from multiple datasheet files, whose names are listed in the current datasheet. The shotpoint data in the individual files must include the X and Y coordinate for the individual shotpoint in columns 1 and 2.
See also
Importing SEG-P1 Data regarding automatic import of SEG-P1 shotpoint data files.
Menu Options
Step-by-Step Summary
- Spatial Filter: Insert a check in this box at the top of the program window to activate a data filter based on spatial coordinates. Click this button to enter the filter settings. Click the Return to Previous Menu button when you are done entering the filter settings. (More info)
- Time Filter: Insert a check in this box at the top of the program window to filter the borehole Aquifer or T-Data based on date/time. This only applies to the Borehole Locations overylay layer, if activated. Click this button to enter the filter settings. Click the Return to Previous Menu button when you are done entering the filter settings. (More info)
- Data Columns: Define the input columns the program is to read. See below for examples of the Single and Multiple layouts.
- Line Title: Select the name of the column in the current datasheet that lists the shotpoint name.
- File Name: Select the name of the data column that lists the names of the individual shotpoint files.
- Map Options
- Seismic Line Style: Click here to select a style and color for the shotpoint lines.
- Symbols
- Starting Point: Click to select the symbol to be used to denote the first point in the list.
- Remaining Points: Click to select the symbol to be used to plot all of the following points on the line.
- Symbol Size: Click here to change the size of the shotpoint symbols, as a percent of the map width.
- Labels: Insert a check here if you want the shotpoint map symbols to include labels.
- Starting Point: Check this for the name of the shotpoint line to be displayed at the starting point.
- Remaining Points: Check this to include number-sequenced labels for the remaining points on the line.
! Be warned that if you have a lot of points, adding labels may make the map difficult to read, and can require some time for the map to generate.
- Map Layers: Select the layers you wish to incorporate into the map, inserting a check-mark in those you wish to include. Establish the settings for each activated layer, such as a background image, axis labels, etc. See 2D Map Layers for more information.
- Output Options: Use these settings to define whether the output graphic is to be saved (or displayed as "untitled"), how the file should be named, and whether it is to be displayed after it is created. It also offers export options. (More info)
- Access the RockWorks Datasheet program tab.
- Be sure you have opened, imported, or typed into the datasheet the names of the individual RwDat files to containing the shotpoints to be plotted. Here's an example of how this file might look (left), linking to the shotpoint files (right).
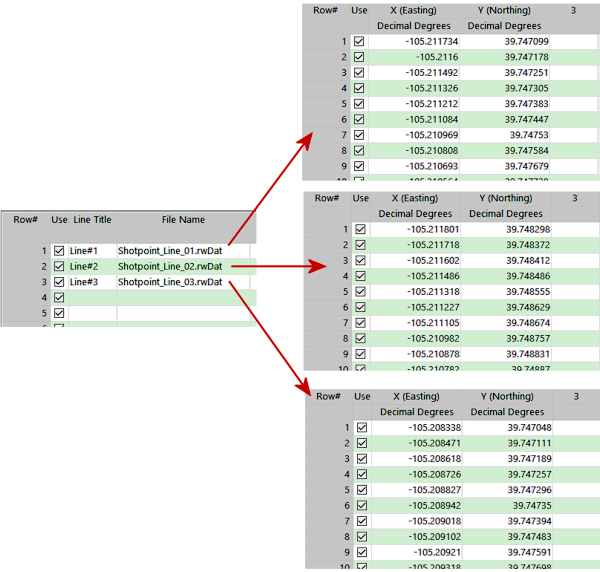
! Click the Example button at the top of the window to load a sample file that is installed with the program.
- Select the Utilities | Maps | Seismic Shotpoints menu option.
- Enter the requested menu settings, described above.
- Click the Continue button to proceed.
- Click the Continue button to proceed.
The program will create a map illustrating the shotpoint locations on the selected seismic lines. The completed map will be displayed in a RockPlot2D tab in the options window, if requested.
- You can adjust any of the settings in the Options window (scaling, fill colors, etc.) and then click the Continue button again to regenerate the map.
- View / save / manipulate / export / print the map in the RockPlot2D window.
 Back to Map Menu Summary

RockWare home page