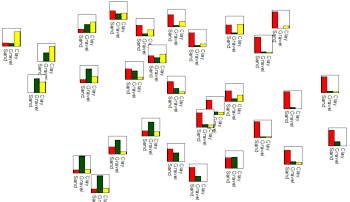
This program reads location data and values for up to 9 selected variables from the RockWorks datasheet, and generates a map with mini-bargraphs at each sample location. The resulting map is displayed in RockPlot2D.
Menu Options
Step-by-Step Summary
! Click the Example buttonat the top of the window to load a sample file that is installed with the program.
This example illustrates the sample file "RockWorks Data\Samples\Soil_Properties_01.rwDat".
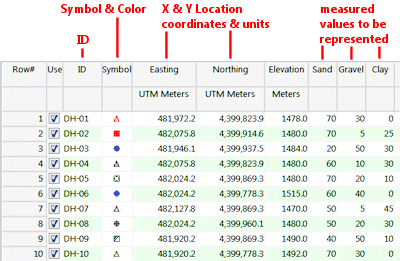
Longitude and latitude coordinates must be in decimal format. If you're using another coordinate system, be sure you've specified the Units and the Projection Settings as appropriate.
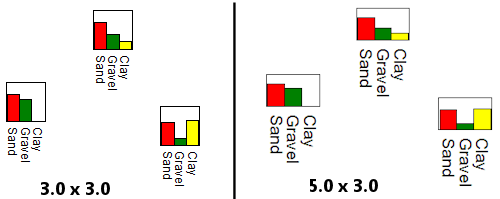
The program will read the selected components from the indicated columns of the datasheet. It will normalize the values and generate small bargraphs at each map location using the requested color and size. The completed map will be displayed in a RockPlot2D tab in the options window, if requested.
![]() Back to Map Menu Summary
Back to Map Menu Summary
![]()