RockWorks | Utilities | Maps | Spider Diagrams
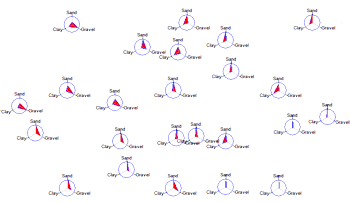
This program reads location data and values for up to 9 selected variables from the Utilities datasheet, and generates a map that illustrates the relative percentage of the selected variables as polygons within a circle, at each sample location. The resulting map is displayed in RockPlot2D.
Menu Options
Step-by-Step Summary
- Spatial Filter: Insert a check in this box at the top of the program window to activate a data filter based on spatial coordinates. Click this button to enter the filter settings. Click the Return to Previous Menu button when you are done entering the filter settings. (More info)
- Time Filter: Insert a check in this box at the top of the program window to filter the borehole Aquifer or T-Data based on date/time. This only applies to the Borehole Locations overylay layer, if activated. Click this button to enter the filter settings. Click the Return to Previous Menu button when you are done entering the filter settings. (More info)
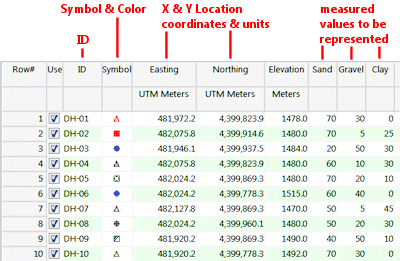
- XY Columns: Use these prompts to tell RockWorks which columns in the input datasheet contain the input coordinates.
Click on an existing name to select a different name from the drop-down list. See a sample data layout below.
- Easting (X): Column that contains the X coordinates for the sample locations.
These can be Eastings in meters or feet, decimal longitudes, etc. See Defining your Datasheet Coordinates for more information.
- Northing (Y): Column that contains the Y coordinates for the points.
- The columns containing the values to be represented in the diagrams are defined below.
- Components: Click this tab to select the items to be represented in the spider diagrams.
- Plot Component # 1 - Plot Component # 9: You can request up to 9 components be represented in the mini spider plots by inserting a check in the appropriate check-box. For each component that you activate, choose the data source and scaling value.
- Column: Click to the right to select the name of the column containing the data listing for that component.
- Scalar: Type in the value for the component which will correspond to the diagram radius. (See also the Scaling setting, below.)
- Diagram Options
- Dimensions
- Diagram Radius: Enter the maximum radius (as a percentage of the map size) of each sample circle.
- Scaling: Select the method to be used to define how variables are scaled.
- Automatic: Easiest. Automatically scale all variables such that the maximum value corresponds to the diagram radius. Note: When this setting is used, the "Maximum Value" settings within each component submenu is ignored.
- Manual: This will use the "Maximum Value" settings with the individual component submenus to define the scaling.
-
- Fill Polygons: Fill all polygons with a user-defined color. Click to the right to select the color to be used to fill the polygons.
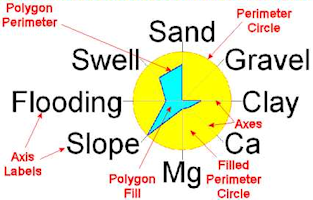
- Plot Polygon Perimeters: Plot a line around the border of the polygons. Click to the right to choose the line style, color, and thickness to be used when plotting a border around the polygons.
- Plot Perimeter Circle: Plot background circle depicting the maximum radius.
- Line Style: Circle perimeter line style, color, and thickness.
- Fill Circle: Fill perimeter circle with a user-defined color. Click the color box to select the fill color to be used when plotting the reference circle.
- Plot Axes: Plot lines from the symbol origin to the maximum radius. Click to the right to select the line color, style, and thickness.
- Labels: Check this box to plot labels at the termination of each component axis. Click on this tab to set up the label options.
- Orientation: Choose Horizontal for horizontal label text, or Radial for labels plotted on radial spokes.
- Font: Axis label font, size, and color.
- Offset: Distance from the maximum radius to the start of the axis label.
- Automatic Offset: Check this box to have the program automatically offset the spider diagrams such that they do not overlap adjacent diagrams. Click on this tab to set up the offset parameters. (More info)
- Map Layers: Select the additional layers you wish to incorporate into the map, inserting a check-mark in those you wish to include. Establish the settings for each activated layer, such as a background image, axis labels, etc. See 2D Map Layers for more information.
- Output Options
- Save Output File: Check this to assign a name for the map in advance, rather than displaying it as Untitled.
- Automatic: Choose this option to have RockWorks assign the name automatically. It will use the name of the current program plus a numeric suffix, plus the ".Rw2D" file name extension.
- Manual: Choose this option to type in a name of your own for this file.
- Display Output: Check this option to have the resulting map displayed in RockPlot2D once it is created.
- Access the RockWorks Datasheet program tab.
- Create a new datasheet and enter or import your data into the datasheet.
Or, open one of the sample files and replace that data with your own. See Data Layout for datasheet examples.
! Click the Example button at the top of the window to load a sample file that is installed with the program.
This example illustrates the sample file "\Documents\RockWorks Data\Samples\Soil_Properties_01.rwDat".
Longitude and latitude coordinates must be in decimal format. If you're using another coordinate system, be sure you've specified the Units and the Projection Settings as appropriate.
- Select the Utilities | Maps | Spider Diagrams menu option.
- Enter the requested menu items, discussed above.
- Click the Continue button to proceed.
The program will read the selected components from the columns in the datasheet and rescale the values automatically or based on the manual settings you've defined. A polygon will be generated for each map location to illustrate the component values. The completed map will be displayed in a RockPlot2D tab in the options window, if requested.
- You can adjust any of the settings in the Options window (scaling, fill colors, etc.) and then click the Continue button again to regenerate the map.
- View / save / manipulate / export / print the map in the RockPlot2D window.
 Back to Map Menu Summary

RockWare home page