RockWorks | Utilities | Maps | Polygons
Use this program to read a listing of XY points from the Datasheet Editor, from multiple datasheets, from a Polygon Table, or from multiple Polygon tables, and create a 2D map with a one or more polygons drawn between these vertices.
See also: Google Earth Polygon Maps for simple polygon maps output to Google Earth.
Feature Level: RockWorks Basic and higher
Menu Options
Step-by-Step Summary
- Spatial Filter: Insert a check in this box at the top of the program window to activate a data filter based on spatial coordinates. Click this button to enter the filter settings. Click the Return to Previous Menu button when you are done entering the filter settings. (More info)
- Time Filter: Insert a check in this box at the top of the program window to filter the borehole Aquifer or T-Data based on date/time. This only applies to the Borehole Locations overylay layer, if activated. Click this button to enter the filter settings. Click the Return to Previous Menu button when you are done entering the filter settings. (More info)
- Data Source
Click this tab to define for the program where you have your polygon coordinate data stored. You have several options.
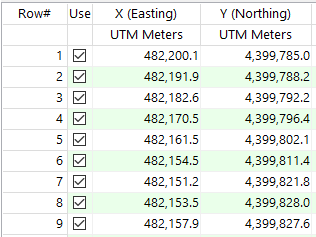
- Datasheet - Single: Click in this option if you will be plotting a single polygon, using a single listing of vertex coordinates in the current datasheet.
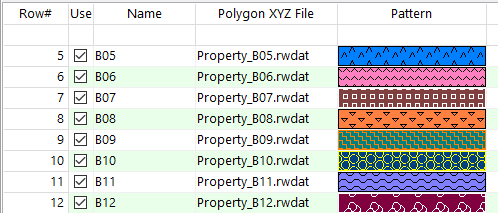
- Datasheet - Multiple: Click in this option if you will be plotting multiple polygons, each listed in its own datasheet. The current datasheet must list the names of these datasheet files (.RwDat).
- Single Polygon Table: Click in this option if you will be plotting a single polygon, using a single listing of vertex coordinates in a Polygon Table.
- Polygon Table: Click to select the name of the Polygon Table containing the coordinates you wish to plot.
- Polygon List Table: Click in this option if you will be plotting multiple polygons, each listed in its own Polygon Table. Here you will select the name of the Polygon List Table which lists the names of the individual Polygon Tables to be included here.
- Polygon List Table: Click to select the name of the Polygon List Table containing the names of the Polygon Tables you wish to plot.
- Appearance
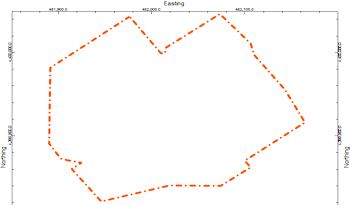
- Perimeter: Check this box to plot a line around the perimter of the polygon. Click the box to the right to choose the line style, color, and thickness for the outline.
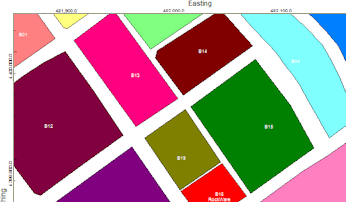
- Fill: Check this box to fill the polygon with a color or pattern.
- Color: Click this option to fill the polygon with a solid color. Click the color box to choose the fill color.
- Pattern: Click this option to fill the polygon with a graphic pattern. Click the pattern box to select the pattern design, density, background color, and pattern color.
- Title: Check this option to include a label in each polygon. (This applies to multiple polygons only.) The title is pulled from the "title" column in the polygon list datasheet or table.
- Size: Enter the size for the text, as a percent of your project size.
- Color: Click the color box to choose a color for the label text.
- Opaque Background: Check this box to fill the label background with a solid color. This is helpful if the label is plotting on top of a filled polygon. Click the color box to choose the background fill color.
- 2D Map Layers
- Insert a check in any of the other map layers which are available to include them with your polygon map. Click on their tab to establish the map settings. See 2D Map Layers for more information.
- Output Options:
- Save Output File: Check this to assign a name for the map in advance, rather than displaying it as Untitled.
- Automatic: Choose this option to have RockWorks assign the name automatically. It will use the name of the current program plus a numeric suffix, plus the ".Rw2D" file name extension.
- Manual: Choose this option to type in a name of your own for this file.
- Display Output: Check this option to have the resulting map displayed in RockPlot2D once it is created.
- Create your polygon datasheet, polygon list datasheet, polygon table, or polygon list table, as described above.
- Select the Utilities | Maps | Polygons menu option.
- Enter the program settings as described above.
- Click the Continue button to proceed.
The program will build the map of the polygon(s) you've defined, using the perimeter, fill, and title settings you specified. The completed map will be displayed in a RockPlot2D tab in the Options window, if requested.
- You can adjust any of the settings in the Options window and then click the Continue button again to regenerate the map.
- View / save / manipulate / export / print the map in the RockPlot2D window.
 Back to Map Menu Summary

RockWare home page