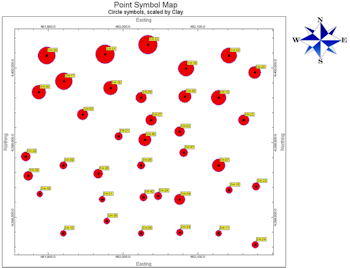
RockWorks | Utilities | Maps | Point Symbols
This program reads X and Y location coordinates from the RockWorks datasheet and builds a map illustrating those sample locations using uniform or variable symbols. Additional map layers include border annotation, background images, and more.
Menu Options
Step-by-Step Summary
- Spatial Filter: Insert a check in this box at the top of the program window to activate a data filter based on spatial coordinates. Click this button to enter the filter settings. Click the Return to Previous Menu button when you are done entering the filter settings. (More info)
- Symbol Options
- XY Columns: Click this tab to define the input columns from the datasheet.
- X (Easting): Select the name of the column in the main datasheet that contains the X or Easting coordinates.
These can be Eastings in meters or feet, decimal longitudes, etc. See Defining your Datasheet Coordinates for more information.
- Y (Northing): Select the column that contains the Y or Northing coordinates.
- Symbols: Check this item to plot symbols on the map or diagram.
Click on this tab to set up the symbol options. (More info)
- Symbol Labels: Check this item to include labels with the point symbols.
Click on this tab to establish the label settings. (More info)
- Map Layers: Select the additional layers you wish to incorporate into the map, inserting a check-mark in those you wish to include. Establish the settings for each activated layer, such as a background image, axis labels, etc. See 2D Map Layers for more information.
- Output Options
- Save Output File: Check this to assign a name for the map in advance, rather than displaying it as Untitled.
- Automatic: Choose this option to have RockWorks assign the name automatically. It will use the name of the current program plus a numeric suffix, plus the ".Rw2D" file name extension.
- Manual: Choose this option to type in a name of your own for this file.
- Display Output: Check this option to have the resulting map displayed in RockPlot2D once it is created.
- Access the RockWorks Datasheet program tab.
- Create a new datasheet and enter or import the location coordinates for the sites to be displayed in the map.
Or, open one of the sample files and replace that data with your own. See Data Layout for datasheet examples.
! Click the Example button at the top of the window to load a sample file that is installed with the program.
- Select the Utilities | Map | Point Symbols menu option.
- Establish the program settings as described above.
- Click the Continue button to create the map.
The program will create the map with the selected layers, and display the map in a RockPlot2D tab in the Options window, if requested.
- You can adjust any of the mapping options along the left and click the Continue button to regenerate the map.
- View / save / manipulate / print / export the map in the RockPlot2D window.
 Back to Map Menu Summary

RockWare home page