RockWorks | Utilities | Maps | Mining Claims
Use this program to read a listing of data from the current datasheet - claim names and 4 pairs of XY corner points - and create a map illustrating the claim blocks, filled with patterns and/or colors, for output to RockPlot2D.
See also:
Google Earth Claim Maps
Feature Level: RockWorks Basic and higher
Menu Options
Step-by-Step Summary
- Spatial Filter: Insert a check in this box at the top of the program window to activate a data filter based on spatial coordinates. Click this button to enter the filter settings. Click the Return to Previous Menu button when you are done entering the filter settings. (More info)
- Time Filter: Insert a check in this box at the top of the program window to filter the borehole Aquifer or T-Data based on date/time. This only applies to the Borehole Locations overylay layer, if activated. Click this button to enter the filter settings. Click the Return to Previous Menu button when you are done entering the filter settings. (More info)
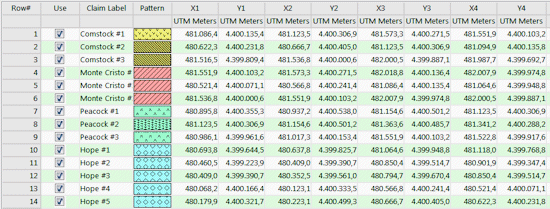
- Data Columns: These prompts tell RockWorks which columns in the current datasheet contain the input data.
Click on an existing name to select a different name from the drop-down list. See a sample data layout below.
- Title: Column that contains the name for the claim, which will be plotted as a label in the output map.
- Pattern: Column that contains the pattern and colors to be used to fill the claim block on the output map.
- X1, Y1: Columns that contain the X and Y coordinates for one of the claim corners.
These can be Eastings and Northings in meters or feet, decimal longitudes, etc. See Defining your Datasheet Coordinates for more information. If you need to calculate the XY coordinates based on PLSS legal descriptions, see the Coords | Public Land Survey - XY program.
- X2, Y2: Columns that contain the X and Y coordinates for next polygon corner.
- X3, Y3: Columns that contain the X and Y coordinates for next polygon corner.
- X4, Y4: Columns that contain the X and Y coordinates for last polygon corner.
- Claim Options
- Plot Titles: Check this box if the claim titles are to be included as labels in the map.
- Text Size: Type in a size for the labels, as a percent of your project area.
- Color: Click the color box to choose a color for the map text.
- Fill Polygons: Check this box to fill the claim blocks with patterns or colors, as read from your datasheet. If you don't have patterns defined in your datasheet, leave this unchecked.
- Patterns: Click in this button to fill the claim rectangles with the patterns and colors listed in the datasheet (whose column name you defined above).
- Colors Only: Click in this button to fill the claim rectangles with the background colors for the patterns which are shown in the datasheet.
- Perimeter Line Style: Click to the right to choose the claim block perimeter line style and color.
- Map Layers: Select the layers you wish to incorporate into the map, inserting a check-mark in those you wish to include. Establish the settings for each activated layer, such as a background image, axis labels, etc. See 2D Map Layers for more information.
- Output Options: Use these settings to define whether the output graphic is to be saved (or displayed as "untitled"), how the file should be named, and whether it is to be displayed after it is created. It also offers export options. (More info)
- Access the RockWorks Datasheet program tab.
- Create a new datasheet and enter or import your claim data into the datasheet.
Or, open one of the sample files and replace that data with your own. See Data Layout for datasheet examples.
! Click the Example button at the top of the window to load a sample file that is installed with the program.
This example illustrates the sample file "\Documents\RockWorks Data\Samples\Earth_Mining_Claims.rwDat".
Longitude and latitude coordinates must be in decimal format. If you're using another coordinate system, be sure you've specified the Units and the Projection Settings as appropriate.
- Select the Utilities | Maps | Mining Claims menu option.
- Enter the program settings as described above.
- Click the Continue button to proceed.
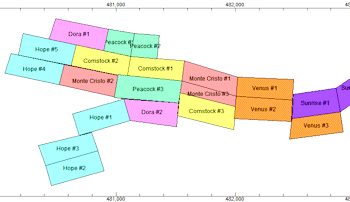
The program will read the corner coordinates from the current data sheet and create a map illustrating the claim rectangles, with specified fill and labeling settings. The completed map will be displayed in a RockPlot2D tab in the Options window, if requested.
- You can adjust any of the settings via the Options tab to the left and then click the Continue button again to regenerate the map.
- View / save / manipulate / export / print the map in the RockPlot2D window.
 Back to Map Menu Summary

RockWare home page