RockWorks | Borehole Operations | P-Data | Statistics Map
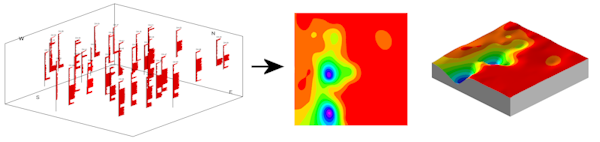
This program provides a means for quickly evaluating the range of g-values for a selected P-Data track without creating a 3D solid model. You can choose to illustrate the highest, lowest, sum, or average data value. The basic idea is that the program will extract an XY location for each borehole and the high/low/sum/average P-Data value (as requested) for that location, and create a grid model and 2D map and/or 3D surface to illustrate this data
! This is different from a P-Data Plan Map in that this map is not extracted from an interpolated solid model - it's gridded directly from the data.
See also
Generating a Statistical Report for a Column of P-Data Values
Creating a Frequency Histogram for a Column of P-Data Values
Feature Level: RockWorks Standard and higher
Menu Options
Step-by-Step Summary
- Rules & Filters: Use the buttons at the top of the window to apply filters and rules for this program. (More info)
- Spatial Filter: Filter the input data for the map based on XYZ location.
- Time Filter: Filter any T-Data or Aquifer data in borehole location map labels, if activated.
-
- P-Data Track
Click this tab to select the track or column in the P-Data table whose data values are to be illustrated in the statistics map.
- Filter(s)
Click this tab to establish any data filtering.
- G-Value Filter: Activate this option to establish a data filter based on the measured values. (More info)
- Resample: Check this box to resample the data. (More info)
- Map Type
Choose one of the following by clicking in the appropriate radio button:
- Z = Lowest P-Data Value: The contours will be based on the lowest g-value for the designated P-Data track.
- Z = Highest P-Data Value: The contours will be based on the highest g-value for the designated P-Data track.
- Z = Sum of P-Data Values: The contours will be based on the average of all of the g-values for the designated P-Data track. For non-vertical boreholes, the xy coordinates for this point will correspond with the last (lowest) P-Data point in the borehole.
- Z = Average P-Data Value: The contours will be based on the average of all of the g-values for the designated I-Data track. For non-vertical boreholes, the xy coordinates for this point will correspond with the last (lowest) I-Data point in the borehole.
- Output Grid
Click here to type in the name to assign the output grid (.RwGrd) that will be created as a result of gridding the selected P-Data values.
- Gridding Method
Click on this tab to establish the gridding method (aka algorithm), the grid dimensions, and other gridding options.
- Dimensions: Specify how the grid dimensions are to be established. Unless there's a specific reason to do otherwise, you should probably leave the grid dimensions set to the current output dimensions.
- Algorithms: Select a gridding method from the list, and establish any method-specific options which are displayed.
- Options: Click this tab to establish the other general gridding options (declustering, logarithmic, high fidelity, etc.).
- 2D Grid Map
Check this box to display the output grid as a 2D map at this time.
Click this tab to set up the 2D map layers (bitmap, symbols, labels, line contours, color-filled contours, labeled cells, map border, etc.).
- Output Options: Use these settings to define whether the output graphic is to be displayed after it is created and how/whether it is to be saved in a file in the project folder. (More info)
- 3D Grid Diagram
Check this box to display the output grid as a 3D surface at this time.
Click this tab to set up the 3D map layers (surface colors, etc.).
! You can request both a 2D and 3D representation of the grid model.
- Output Options: Use these settings to define whether the output scene is to be displayed after it is created and how/whether it is to be saved in a file in the project folder. (More info)
Follow these steps to create a 2D map and/or a 3D surface that represents the P-Data summary:
- Access the RockWorks Borehole Manager program tab.
- Enter/import your data into the Borehole Manager, if you have not already done so.
- Be sure the boreholes whose data is to be processed are enabled.
- Select the Borehole Operations | P-Data | Statistics Map menu option.
- Enter the requested program settings, described above
- Click the Continue button to proceed.
For vertical holes, the program will extract from the Location tab the X and Y locations for each active borehole. It will then determine the highest, lowest, average, or sum of data values (as requested) for the selected track for each hole. Along with the X and Y values, this new "Z" value will be passed to the gridding routine.
For inclined or deviated holes, the program will extract the X and Y locations from the Location tab if a min-value or max-value map was requested. For average or sum maps, the X,Y coordinates for the borehole will correspond with the last (lowest) P-data point in the hole. The Z values will be determined in the same fashion as described above.
The program will then create the high, low, average, or sum grid model. It will then create the 2D map and/or 3D surface using the requested diagram settings. If requested, the completed map/surface will be displayed in a RockPlot2D tab and/or RockPlot3D tab in the Options window.
- You can adjust any of the modeling or diagram option in the main Options tab to the left and then click the Continue button again to regenerate the P-Data statistics map.
- View / save / manipulate / print / export the image in the RockPlot2D or RockPlot3D window.
 Back to P-Data Menu Summary

RockWare home page