RockWorks | Borehole Operations | P-Data | Statistics
This program is used to calculate statistics for a single column of P-Data measurements in the current project, for all enabled boreholes. This can be a handy way to get a quick look at the range and distribution of values prior to, or after, modeling.
Feature Level: RockWorks Standard and higher
Menu Options
Step-by-Step Summary
- Spatial Filter
Use this tab at the top of the window to apply spatial filters to data being processed for the report. (More info)
- P-Data Track
Click this tab to select the name of the P-Data column for which statistics will be calculated. Expand this heading to establish any spatial or value filters to apply to the data before running the statistics.
- Filter Based on G-Values: Activate this option to filter the data based on the measured values. (More info)
- Resample at Regularly-Spaced Intervals: Check this box to resample the data being processed. (More info)
- Create Filter / Sampling Report: If you've selected any filter/resampling options, this tool will create a summary report of the results. (More info)
- Report Titles
Click this tab to specify report titles.
- Primary: Click to the right to enter the text to be plotted as the primary title at the top of the Statistics Report. If no title is desired, click on the Primary heading and delete any text that's displayed there.
- Secondary: Click to the right to enter the text to be plotted as the secondary title beneath the Primary Title at the top of the Statistics Report. If no title is desired, click on the Secondary heading and delete any text that's displayed there.
- Output Options
Click this tab to define the output format(s) for the report. (More info)
- RwDat (RockWorks): Click in this button if you want the report generated in a RockWorks datasheet (.RwDat) format.
- CSV (Excel): Click in this button if you want the report generated in a CSV file format for use in Excel.
- TXT (Notepad): Click in this button if you want the report generated in a text (.txt) format.
- RTF (Word): Click in this button if you want the report generated in an RTF file format for use in Word.
- Access the RockWorks Borehole Manager program tab.
- Enter/import your data into the Borehole Manager, if you have not done so already.
- Be sure the boreholes for which you wish to generate the statistical report are enabled.
- Select the Borehole Operations | P-Data | Statistics menu option.
- Enter the requested program settings, described above.
- Click the Continue button to proceed.
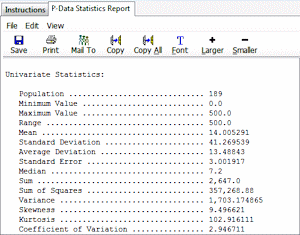
RockWorks will read the selected track of data for the enabled boreholes, apply any requested filtering operations, and then compute the general statistics. The statistical summary will be displayed in the requested output format(s).
- You can adjust any of the input options, and click the Continue button again to create new report(s).
 Back to P-Data Menu Summary

RockWare home page