The Labeled Axes layer is offered in all RockWorks map windows. It is used to annotate the map or diagram with axis titles, axis lines and tick-marks, tick mark (coordinate) labels, and/or reference lines. Click on the Labeled Axes tab to access these settings.
! Note that these items can also be modified after the map is generated and displayed in RockPlot2D.
Use the map at the top of the Labeled Axes tab to see which items are on/off.
 Labeled Axes
- Horizontals
Check this item to plot reference lines horizontally across the map. Major lines will plot at the label increment of the vertical axes. Minor lines will plot at the tick mark increment of the vertical axes. Click on the line graphics to the right to choose the line style/thickness/color for the Major and Minor horizontal lines.
- Verticals
Check this item to plot reference lines vertically across the map. Major lines will plot at the label increment of the horizontal axes. Minor lines will plot at the tick mark increment of the horizontal axes. Click on the line graphics to the right to choose the lines style/color/thickness for the lines.
- Perimeter
Use this check-box in the graphic area to determine if a solid line perimeter should surround the map. Click the line graphic to the right to choose the line style/color/thickness for the perimeter line.
- Titles
Use these check-marks to turn on/off the plotting of the titles along the eastern (E), western (W), northern (N), and southern (S) borders of the map. Note that you can define axis titles independently from plotting the axis lines themselves, below. For example, you could specify a North/Top title of "CONTOUR MAP" with no axis lines selected to generate a simple title for the map. The actual text to be used for the titles is defined in the Axis Titles prompts, discussed below.
- Color: Click the color box to choose the color for the axis title text.
- Size: Type in a size for the axis title text, as a percent of your project size.
- Axes
Use these check-marks to turn on/off the plotting of the axis lines and tick marks along the eastern (E), western (W), northern (N), and southern (S) borders of the map.
- Line: Click the line box to choose the style/color for the axis lines.
- Size: Type in a size for the axis tick marks, as a percent of your project size.
- Labels
Use these check-marks to turn on/off the plotting of coordinate labels along the axis lines.
- Color: Click the color box to choose the color for the axis label text.
- Size: Type in a size for the axis label text, as a percent of your project size.
- Ticks
- Inside: Check this for the tick marks to plot inside the axis line.
- Outside: Check this for the tick marks to plot outside the axis line.
! Note that you can turn on both Inside and Outside tick marks.
- Axis Titles
Use these prompts to enter the text for the text, if any, that is to plot along the indicated axes.
! Only those axis titles which are actually turned on (above) will be plotted, even if text is entered here.
- North Axis: This text will label the top or north edge of the diagram or map.
- South Axis: This text will label the bottom or south edge of the diagram or map.
- East Axis: This text will label the right or east edge of the diagram or map.
- West Axis: This text will label the left or west edge of the diagram or map.
- Dimensions
Use these options to define how the overall extents of the map borders are to be defined. See the description here, and more graphic examples at the end of this topic.
- Automatic: Choose this option for the program to determine the axis extents and divisions automatically, based on the overall dimensions of the current map or diagram.
- Project Dimensions: Choose this if the borders are to be plotted at the boundaries currently defined in the Project Dimensions.
- Adjust/Examine Output Dimensions: Click on this button to view and/or reset the project's dimensions. These are the same settings you can access in the Dimensions section of the Project tab. Click here for more information.
- Manual: Choose this to define the minimum and maximum extents of the border manually using the prompts that will be displayed.
- Manual Intervals: Check this box to define the sub-intervals manually. You can define these regardless of the Border Dimensions options you choose (described above).
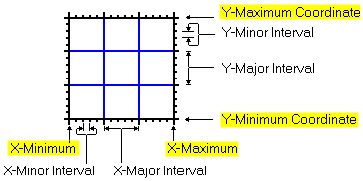
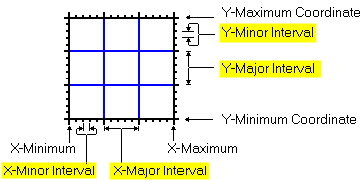
- X Minor, X Major: Type in the interval, in your map units, at which the X axis labels and major vertical dividers will be plotted (if activated).
- Y Minor, Y Major: Type in the interval, in your map units, at which the Y axis labels and major horizontal divider lines will be plotted (if activated).
-
- Margins
- Horizontal: Use this setting to define how far outside the map edge the west and east axes should be placed, expressed as a percent of the diagram width. (Default = 2)
- Vertical: Use this setting to define how far outside the map edge the north and south axes should be placed. (Default = 2)
- Manually Specify Decimals: Insert a check here if you wish to specify how many decimal places are to be displayed in the axis (tick-mark) labels, using the small prompt. Note that if your map coordinates are recorded in longtitude and latitude, you will need more decimal places (e.g. 6) than if they are recorded in UTM integers.
Labeled Axes Dimensions: Which to choose? Consider these points:
| Dimensioning Method |
Advantages |
Disadvantages |
| Project Dimensions |
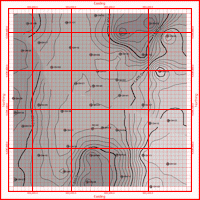
All maps will have the same border dimensions - useful when plotting different data sets that have different sample locations (e.g. surface geochemical sample sites based on outcrops versus drill hole locations). See Figure 1, below. |
Sample labels may extend beyond map borders. See Figure 2, below. |
| Automatic |
Map borders are automatically set based on the extents of the data. Map borders will be automatically increased to include sample labels. See Figure 3, below. |
Different data sets will have different map dimensions. See Figure 4, below. |
| Manual |
Map dimensions may be manually specified such that sample labels will be enclosed within map borders. Maps of different data sets will all be the same size. |
It's a hassle to manually specify the map dimensions. |
Figure 1: Different data sets, same map dimensions.
Figure 2. Sample labels extending beyond map borders.
Figure 3. Map borders based on output dimensions versus map borders based on data range.
Figure 4. The two maps along the top were plotted using the automatic border dimensioning. The two maps along the bottom were plotting using the output-dimensions border option. Note how the maps along the base show the locations of the magnetic and gravity surveys relative to each other whereas the maps along the top are very misleading

RockWare home page