The Borehole Locations layer is offered in most RockWorks map windows, in the Map Overlays grouping. It is used to create a map layer with symbols noting the borehole locations, read from the Borehole Manager database. You can include lines noting the log traces for non-vertical boreholes, and/or a variety of data labels. Click on the Borehole Locations tab to access these settings.
- Symbols: Check this box to include map symbols.
- Raster Symbols: Check this item to use raster symbols to show borehole locations.
- Size: Click here to specify the symbol size, expressed as a percent of your project size. A good place to start is "2.0".
- Type
- Use Borehole Raster Symbols: Choose this option if the raster symbol listed in each borehole's Location tab should be used in the map.
- Other: Choose this option if all of the symbols are to be the same. Click on the sample to select the raster symbol style.
- Vector Symbols: Check this item to use vector symbols to show borehole locations. You can plot both raster and vector symbols; the vector symbols will plot on top of the rasters.
- Size: Specify the symbol size, as a percent of your project size.
- Thickness: Click here to specify the thickness for the lines to be used to draw the vector symbols. "1" = thin lines. "3" = thick.
- Type
- Use Borehole Vector Symbols: Choose this option if the vector symbol listed in each borehole's Location tab should be used in the map.
- Other: Choose this option if all of the symbols are to be the same. Click on the sample to select the vector symbol style.
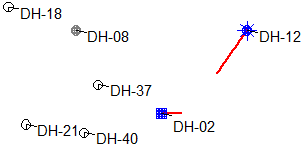
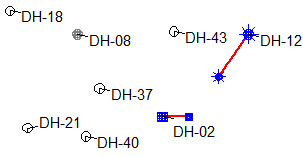
Log Traces: Check this item to include a plan-view display of the trace of non-vertical wells. Click on the Line Style box to select the log trace line style, thickness, and color. The example below shows two wells with log traces plotted in red.
- Line Style: Click here to choose the line style, thickness, and color for the log traces.
- Plot TD Symbol: Check this box to include a copy of the collar symbol at the TD location.
- Size: Specify the size for the symbol, as a percent of the project size; you may want to make it smaller than the collar symbol.
- Thickness: Enter the thickness for the lines to be used to draw the vector symbols. "1" = thin lines. "3" = thick
-
- Borehole IDs: Check this to include labels of the borehole names. Use the prompts to type in a label prefix (such as "BH-") and/or suffix.
- Coordinates: Check this to include in the labels the Easting and Northing coordinates, pulled from the Location table. Use the prompt boxes to type in a label prefix (such as "X:" or "Y:") and/or suffix. If no prefix or suffix is desired, leave these prompts blank.
! The values will plot in the Output units (feet or meters) you've defined.
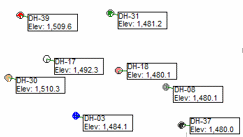
- Elevations: Check this box to include in the labels the boreholes' surface elevations, pulled from the "Z (Elevation)" field in the Location table. Use the prompts to type in a label prefix (such as "Elev:" and/or suffix ("meters"). If no prefix or suffix is desired, leave these prompts blank.
- Collar Elevations: Check this box to include in the labels the boreholes' surface elevations, pulled from the "Collar Elevation" field in the Location table. Use the prompts to type in a label prefix (such as "Collar:" and/or suffix ("meters"). If no prefix or suffix is desired, leave these prompts blank.
- Total Depths: Check this box to include in the label each borehole's Total Depth, pulled from the Location table. Use the prompts to enter a label prefix (such as "TD:") and/or suffix (such as "feet").
- Stratigraphy Data: Check this box to include in the map labels a variety of stratigraphic data.
- Stratigraphic Unit: Click the large button to select the name of the formation, listed in your project's Stratigraphy Types Table, whose data is to be used in the labels.
- Superface Depth: Check this to include the depth to the formation top, for each hole. Enter any desired prefix or suffix in the prompts.
- Superface Elevation: Check this to include the elevation at the top of the formation. The program will label the true elevation, taking into account any borehole deviation. Enter any desired prefix or suffix.
- Subface Depth: Check this to include the depth to the formation base. Enter any desired prefix or suffix in the prompts.
- Subface Elevation: Check this to include the elevation at the base of the formation. The program will label the true elevation, taking into account any well deviation. Enter any desired prefix or suffix.
- Thickness: Check this to include the formation thickness.
- Aquifer Data: Check this box to include in the borehole labels a variety of data pulled from the Water Levels table.
- Aquifer: Click here to choose the name of the aquifer whose data is to be represented in the map. The list will be pulled from your Aquifer Types Table.
- Annotation:
- Superface Depth: Check this to include in the labels the depth to the aquifer top, for each hole. Enter any desired prefix or suffix in the prompts.
- Superface Elevation: Check this to include the elevation at the top of the aquifer. The program will label the true elevation, taking into account any borehole deviation. Enter any desired prefix or suffix.
- Subface Depth: Check this to include the depth to the aquifer base. Enter any desired prefix or suffix.
- Subface Elevation: Check this to include in the labels the elevation at the base of the aquifer. The program will label the true elevation, taking into account any well deviation. Enter any prefix or suffix.
- Thickness: Check this to label the aquifer thickness.
- Include Date & Time Information: Check this to include date/time labels.
- Rules & Filters: Be sure to use these settings, along the far right side of the program window, to invoke date filters for your water level data.
- T-Data: Check this box to include in the borehole labels a variety of data pulled from the T-Data (Time Intervals) table.
- T-Data to be Displayed
- All T-Data Types: Click on this button to pull data from all of the T-Data columns for the labels.
- Single Type of T-Data: Click on this button to pick a single column of T-Data measurements. Click on the button to select the column name.
- Annotation
- Superface Depth: Check this to include in the labels the depth to the T-Data intervals, for each hole. Enter any desired prefix or suffix in the prompts.
- Superface Elevation: Check this to include the elevation at the top of the T-Data intervals. The program will label the true elevation, taking into account any borehole deviation. Enter any desired prefix or suffix.
- Subface Depth: Check this to include the depth to the T-Data interval base. Enter any desired prefix or suffix.
- Subface Elevation: Check this to include in the labels the elevation at the base of the interval. The program will label the true elevation, taking into account any well deviation. Enter any prefix or suffix.
- Thickness: Check this to label the T-Data interval thickness.
- Filters: Use these options to define a specific data range for the items to be included in the labels.
- Depth: Check this box to define a specific depth range for the values to be included in the labels. For example, if you only want to plot labels for T-Data measurements that occurred from ground down to 15 feet, you could set 0 for the minimum and 15 for the maximum.
- Elevation: Check this box to define a specific elevation range for the values to be included in the labels. Enter the desired minimum and maximum elevations.
- G-Value: Check this box to define a real number value range for the measurements to be included in the labels. For example, if you were only interested in displaying labels for values exceeding 0.75, you would enter 0.75 in the Minimum prompt and a very high number (such as 9999) in the Maximum prompt.
- Click here for an example of a map created with a variety of T-Data filters.
- Rules & Filters: Be sure to use these settings, along the far right side of the program window, to specify the date target to be used in the labels
- Optional Fields: Check this box to include in the borehole labels the content from optional Location table fields. (See Setting Up Optional Fields for Borehole Locations for more information.) These work nicely with the Bubble Map layer, below. See the Label Options settings, below, for the number of decimal places for numeric data.
- Fields: Listed in this section will be all of the optional fields in your current project's Location table. Insert a check in those whose data are to be displayed in the label text.
- Include Field Name: Insert a check here to include the name of the field in each label, in addition to the value. For example:
"Longitude: -91.12345" versus "-91.12345"
- Include Prefix: Insert a check here to add a prefix before the numeric value. This will be added for all of the selected optional field labels.
- Include Postfix: Insert a check here to add a suffix after the numeric value. This will be added for all of the selected optional field labels.
- Bubble Map: Insert a check here to display quantitative data from optional location fields with scaled circle symbols or "bubbles." The bubbles will be sized based on the value in the field. This is a quick way to visualize quantitative data.
- Label Options
- Opaque Background: Check this box to plot the labels over a solid color, blocking out any map background from showing through. Select the fill color by clicking on the small color box. In the examples above, the right map has opaque background activated and set to white.
- Enclosing Rectangle: Insert a check here to bound the label(s), specified above, inside a rectangle. Click on the sample to set the rectangle's thickness, line style, and color.
- Leader Lines: Insert a check in this box to include small lines between the label block and the map symbol. Select the line style, thickness, and color by clicking on the line properties box.
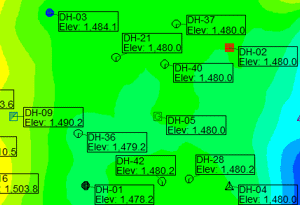
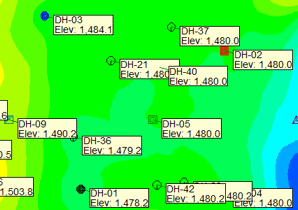
- Auto-Offset: Check this box to have RockWorks place the label block automatically to prevent overprinting. Compare the examples below: The left sample has auto-offset labels and the right sample does not.
-
- Initial Offset Relative to Symbol: Defines the offset of the label from the symbol (as a percent of project size). This starting value will be increased as necessary if you activate auto-offset.
- Font:
- Color: Choose the color for all of the map labels.
- Size: Choose the size for the map labels, as a percent of the project size.
- Decimals: Define the number of decimal places to be displayed in any numeric labels.
- Missing Data: Use these settings to define how the program will represent missing stratigraphy data in the map labels. Examples: The unit's base is missing (the borehole stops mid-unit), the unit's top is missing (eroded above-ground, or never encountered in a directional bore), or the unit is missing completely.
- Show as "Undefined": The program will display thickness or elevation labels as Undefined. So as not to appear ill-mannered, the program will also omit any suffix labels (preventing "Thickness: Undefined feet", using instead "Thickness: Undefined" ).
- Omit Altogether: The program will omit the label completely.
- Combine all Symbols & Labels into 1 Layer: Leave this box, at the bottom of the window, un-checked (default setting) if the borehole location map components should be created as separate map layers: Symbols separate from Labels separate from Leader Lines, separate from Log Traces. Insert a check in this box if you prefer that the symbols, labels, leader lines, and log traces be grouped into a single map layer for easier layer management.

RockWare home page