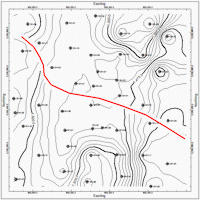
The Faults layer is used to create a 2D map layer with lines that represent the faults which are listed and active in the Faults program tab. For 3D faults, you can choose to plot all triangles projected onto the map, or simply a polyline representing the intersection of the fault with a specific surface (.RwGrd file) or elevation. 2D faults are vertical and are always represented as a polyline. The line style and color for each fault polyline are defined in the Faults tab.
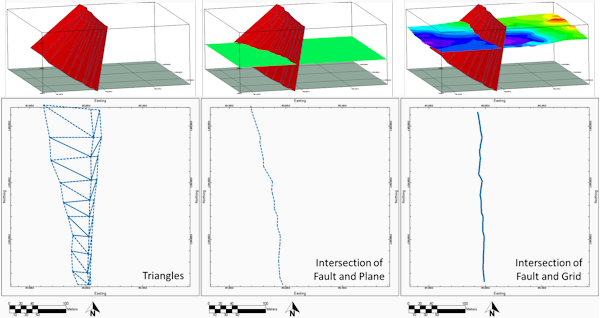
- 3D Fault Settings: Use these options to define how the active 3D fault(s) are to be plotted in the 2D map.
- Plot All Fault Triangles: The outline of each triangle of each active fault is projected onto the 2D map.
- Plot Intersections of Faults & Horizontal Plane: Enter a Horizontal Plane Elevation. The program will plot the intersection of each active fault and the plane as a polyline.
- Plot Intersections of Faults & Grid Model: Select an existing RwGrd file. The program will plot the intersection of each active fault and the RwGrd file as a polyline.
- 2D & 3D Fault Settings: These settings apply to both 2D and 3D faults.
- Polyline Smoothing Factor: Use this setting to force RockWorks to apply smoothing to the fault polyline. You can request 1, 2, or more smoothing passes. For no smoothing, set this to 0 (default).
- Plot Fault Titles: Insert a check in this box if the name of the fault is to be included in the fault polyline. The fault names are defined in the Faults tab.
- Font Size: Enter the size for the font labels, as a percent of the project size.
- Spacing: Enter the spacing for the labels along the polyline, as a percent of the project size.
- Opaque Background: Check this option if the fault name labels should be plotted against an opaque background, helpful if this layer will be overlying a contour or image map. Choose the fill color by clicking on the color box.
- Font Color = Fault Color: If you want the fault label to be plotted in the same color as the fault polyline, check this box. Otherwise, leave it unchecked for black labels.
- Plot Symbols: Check this option if you have defined symbols for the fault and they are to be displayed here. The type of symbol to be displayed (such as hatchures, triangles, or custom symbols) are defined in the Faults tab.
- Symbol Size: Enter the size for the polyline symbols, as a percent of project size.
- Spacing: Enter the spacing for the symbols along the polyline, as a percent of project size.

RockWare home page