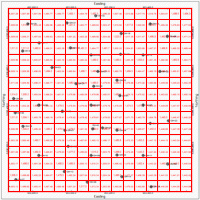
The Labeled Cells layer is offered in many RockWorks map windows. It is used to display grid cell boundaries with numeric values of the nodes listed inside.
! Note that this layer is available only for grid-based maps.
 Labeled Cells
Check this option to activate the Labeled Cells layer.
Click on this tab to establish the layer settings.
- Cell Borders:
- Cell Borders: Click in the indicated radio button for Borders to be plotted, or for No Borders.
- Color: Choose how the border line color is to be established.
- Variable: Choose this option to display the cell lines in variable colors, a cold to hot color scheme, based on the value of the grid nodes.
- Monochromatic: Choose this option to display the cell lines in a single color. Click on the Color box to choose the color.
- Label Color: Use this setting to select the color for the labels:
- Monochrome: Choose this option to display the labels in a single color. Click on the Color box to choose the color.
- Variable: Choose this option to display the labels in variable colors, using a colod to hot scheme, based on the value of the grid nodes.
- Background Color
- Opaque: Choose this option to have the labels displayed against an opaque background. This can be helpful if the labeled cell image will overlay other map layers. Select the label background color using the small color box.
- Transparent: Choose this option if the cell labels are to have no solid background fill.
- Label Decimals
- Automatic : Select this option if you want the program to determine the appropriate number of decimal places automatically, based on the range of node values in the grid file.
- Manual : Click in this radio button if you prefer to set the number of decimal places yourself, using the small prompt.
- Label Misc.
- Omit Zeroes: Check this bo to omit from the map those cells whose node values are equal to zero. This can be handy if you have filtered a grid model and wish to see only non-zero nodes.
- Omit Null Values: Select this option to omit from the map those cells whose node values are set to the RockWorks null value. As above, this can be handy if you have filtered a grid model and wish to see only non-null nodes.
- Label Angle: Use this setting to define the angle for the cell labels. "90" = horizontal, "0" = vertical, upward, and "180" = vertical downward. Any angle is allowed.
The labels will be scaled automatically to fit within the grid cells in the map. Be warned that if it is a high-density grid model, the cell map may be unreadable unless you enlarge specific areas in the RockPlot2D window.

RockWare home page