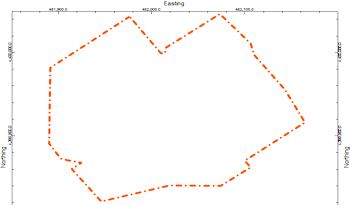
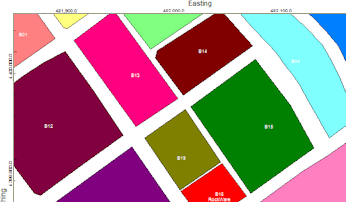
The Polygons layer is available as a Map Overlay for most RockWorks maps. It is used to read a listing of XY points from the Datasheet Editor, from multiple datasheets, from a Polygon Table, or from multiple Polygon tables, and create a 2D map layer with a one or more polygons drawn between these vertices.
 Polygons
Check this box to include a polygon map as a layer with your other map(s).
Click on this tab to access the map settings.
- Data Source
Click this tab to define for the program where you have your polygon coordinate data stored. You have several options.
- Datasheet - Single: Click in this option if you will be plotting a single polygon, using a single listing of vertex coordinates in the current datasheet.
- Datasheet Input Columns
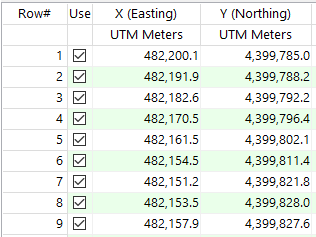
- X (Easting): Click here to select the name of the column in the current datasheet where the polygon's X coordinates are listed.
- Y (Northing): Click here to select the name of the column in the current datasheet where the polygon's Y coordinates are listed.
Here is an example of how this datasheet might look.
- Datasheet - Multiple: Click in this option if you will be plotting multiple polygons, each listed in its own datasheet. The current datasheet must list the names of these datasheet files (.RwDat).
- Datasheet Input Columns
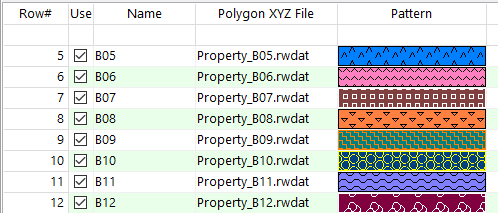
- Title: Click here to select the name of the column in the current datasheet where the title for each polygon is listed. (In the example below, you would choose the column "Name".)
- File: Click here to select the name of the column in the current datasheet where the individual polygon datasheet names are listed. (In the example below, you would choose the column "Polygon XYZ File".)
Here is an example of how this datasheet might look:
- Single Polygon Table: Click in this option if you will be plotting a single polygon, using a single listing of vertex coordinates in a Polygon Table.
- Polygon Table: Click to select the name of the Polygon Table containing the coordinates you wish to plot.
- Polygon List Table: Click in this option if you will be plotting multiple polygons, each listed in its own Polygon Table. Here you will select the name of the Polygon List Table which lists the names of the individual Polygon Tables to be included here.
- Polygon List Table: Click to select the name of the Polygon List Table containing the names of the Polygon Tables you wish to plot.
- Appearance
- Perimeter: Check this box to plot a line around the perimeter of the polygon(s). Click the box to the right to choose the line style, color, and thickness for the outline.
- Fill: Check this box to fill the polygon(s) with a color or pattern.
- Color: Click this option to fill the polygon(s) with a solid color. Click the color box to choose the fill color.
- Pattern: Click this option to fill the polygon(s) with a graphic pattern. Click the pattern box to select the pattern design, density, background color, and pattern color.
- Column: If the data source is a Polygon List datasheet, and if you have a pattern defined in the datasheet, as in the graphic example above, you can choose this option to fill the polygons using the patterns in the datasheet. Select the name of the column where the patterns are listed.
- Title: Check this option to include a label in each polygon. If you are plotting multiple polygons, the title is pulled automatically from the "title" column in the polygon list datasheet or table. If you are plotting a single polygon, you can define the text using the Caption prompt.
- Caption: (Single polygons only) Enter the text to be plotted as the title.
- Size: Enter the size for the text, as a percent of your project size.
- Color: Click the color box to choose a color for the label text.
- Opaque Background: Check this box to fill the label background with a solid color. This is helpful if the label is plotting on top of a filled polygon. Click the color box to choose the background fill color.
- Utilities | Maps | Polygons for a stand-alone version of this map type.

RockWare home page