RockWorks | Borehole Operations | I-Data | Surface Map
Use this program to:
- Create a new 3-dimensional solid or block model representing your downhole interval-sampled data (an .RwMod file)
- OR -
Read an existing .RwMod file you've already created.
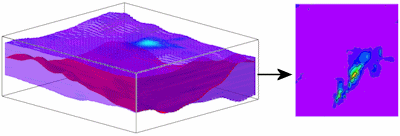
- Create a 2-dimensional map representing the interpolated values where the model intersects a designated surface (.RwGrd file).
The surface extraction will be stored as an .RwGrd model in your project folder. Standard color- and line-contour options are available. The completed map can be displayed in RockPlot2D.
See also
I-Data Plan Maps extracted along a horizontal plane.
Feature Level: RockWorks Standard and higher
Menu Options
Step-by-Step Summary
Tips
- Rules & Filters: Use the buttons at the top of the window to apply filters and rules for this program. (More info)
- Spatial Filter: Filter the input data for the I-Data model based on XYZ location, filter the data to be displayed in striplogs, if activated. Note that these tools filter the data that is passed to the modeling and log-generating procedures. This is distinct from the filters that are applied once the model is completed, and described below.
- Time Filter: Check this item to filter any T-Data or Water Level measurements if included as a borehole map layer.
- Model
Click this tab to define whether you wish to use an existing solid model (from a previous use of this program or another I-Data menu program) or you wish to create a new solid model and set the modeling options.
! NOTE This is not trivial. Creating the solid model can take some time, depending on the resolution of the model and the detail of your data. If you already created a pleasing model for display as a section diagram, for example, you can use the same model, which was stored on disk as an .RwMod file, for the surface map.
- Create New Model: If you want to create a new solid model to be represented in the surface map, click in this radio button, and use the tabs to the right to establish the modeling settings.
- I-Data Input
- Track: Click on this item to select the track or column in the I-Data table that is to be modeled. The names displayed in the list will be pulled from the column headings.
- G-Value Filter: Activate this option to establish a data filter based on the measured values (geochemistry, etc.). Click on this tab to establish the filter parameters. (More info)
- Resample: Check this box to resample the data and click on the tab to establish the resampling options. (More info)
- Solid to be created: Click to the right to enter a name for the I-Data model. The program will append automatically the file name extension ".RwMod".
- Algorithm: Click this tab to select the modeling method to use, for interpolating your I-Data model. (More info)
- Special Options: Click on this tab to establish other model settings, such as tilting, warping, filtering above-ground, and smoothing. (More info)
- Dimensions: Click here to establish the output dimensions of the solid model. (More info)
- Use Existing Model
Click in this radio button if you wish to use an already-existing solid model of your interval data, to generate the surface map.
Click on this tab to specify the name of the existing model.
- Solid Model: Click to the right to browse for the name of the existing existing solid model (.RwMod file) to be used for this diagram.
- Surface Grid
Click this tab to browse for the name of the grid model (.RwGrd) to be used to create the I-data surface. This would typically represent the ground surface, but could also be a surface representing an aquifer, a stratigraphic layer, a fracture plane, etc.
! Be sure the Surface Grid you specify has the same node dimensions and spacing in the X,Y directions as your input solid model.
- Output Grid
Click here to type in the name to assign the output grid (.RwGrd) that will be created. This grid model's nodes will be assigned the solid model G values where they intersect the input Surface Grid.
- Grid Display
Click here to set up how the output map should look.
- Colored Intervals: Insert a check here to include color contours to represent the I-data values. Use the options to the right to access the various options. (More info)
- Contour Lines: Check this box to display the I-Data values using line contours. (More info)
- Labeled Cells: Check this to include a map layer that displays the solid model node values as labeled cells. (More info)
- Gradient Vectors: Check this to include a map layer that displays up or down-gradients with scalable arrows. (More info)
- Other Map Layers
Use the remaining check-boxes to set up the other map layers (images, overlays, peripherals, etc.).
- Output Options
Click this tab to save/display the output map.
- Save Output File: Check this to assign a name for the map in advance, rather than displaying it as Untitled.
- Automatic: Choose this option to have RockWorks assign the name automatically. It will use the name of the current program plus a numeric suffix, plus the ".Rw2D" file name extension.
- Manual: Choose this option to type in a name of your own for this file.
- Display Output: Check this option to have the resulting map displayed in RockPlot2D once it is created.
Follow these steps to create a 2D map that displays the modeled I-data along a user-specified grid surface:
- Access the RockWorks Borehole Manager program tab.
- Enter/import your data into the Borehole Manager. This tool specifically reads location, orientation (if any), and I-data.
- Select the Borehole Operations | I-Data | Surface Map menu option.
- Enter the requested program settings, described above.
- Click the Continue button to proceed.
If you've selected Use Existing Model, the program will load the information from the existing model (.RwMod file), and will proceed to diagram generation.
If you've selected Create New Model, RockWorks will scan the project database and extract the XYZ points for all of the downhole measurements for the selected I-Data track. (For I-Data, the elevations will represent interval midpoints.) It will apply any source data filters you have requested.
RockWorks will use the selected algorithm to create a solid model of the downhole interval data representing geochemistry, geotechnical measurements, etc. The completed model will be stored on disk under the indicated file name.
The program will then load the specified Surface Grid model. For each grid node, it will determine the I-Data model G value at the corresponding location in the solid model, and store that value in the output grid model. The program will then create the 2D map using the requested diagram settings, displaying it in a RockPlot2D tab in the Options window, if requested.
- You can adjust any of the modeling or diagram options in the main Options tab to the left and then click the Continue button again to regenerate the I-Data surface map.
! If the I-Data model looks OK and you just need to adjust one of the diagram settings, you don't need to keep re-interpolating the model. Choose Use Existing Model and browse for the MOD file to be used for the map.
- View / save / manipulate / print / export the image in the RockPlot2D window.
- Double-click on the plan map in RockPlot2D to access the colorfill settings. There, you can adjust the minimum contour level, transparency, etc.
 Back to I-Data Menu Summary

RockWare home page