RockWorks | Borehole Operations | Colors | Plan Map
Use this program to:
- Create a new 3-dimensional solid or block model representing your downhole color intervals (an .RwMod file)
- OR -
Read an existing .RwMod file you've already created.
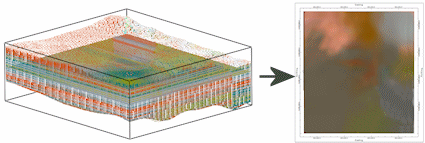
- Create a 2-dimensional map representing the colors where they intersect a horizontal plane.
In other words, it creates a color-based geological map based on downhole data. The color model stores the actual Windows color for each node. The completed map is displayed in RockPlot2D.
See also
Color Model Surface Maps for maps that intersect a grid-based surface.
Feature Level: RockWorks Standard and higher
Menu Options
Step-by-Step Summary
Tips
- Rules & Filters: Use the buttons at the top of the window to apply filters and rules for this program. (More info)
- Spatial Filter: Filter the input data for the color model based on XYZ location. Note that these tools filter the data that is passed to the modeling and map-generating procedures. This is distinct from the filters that are applied once the model is completed, and described below.
- Time Filter: Check this item to filter any T-Data or Water Level measurements if included as a borehole map layer.
-
- Model: First, tell the program whether you wish to use an existing color solid model (from a previous use of this program or another Colors menu tool) or you wish to create a new color solid model, by clicking in the appropriate radio button.
! NOTE This is not trivial. Creating the model can take some time, depending on the resolution of the model and the detail of your data. If you already created a pleasing model for display as a solid, for example, you can use the same model, which was stored on disk as an .RwMod file, for the plan map.
- Create New Model: If want to create a new model, click in this radio button, and use the tabs to the right to establish the modeling settings.
- Solid To Be Created: Click to the right to enter a name for the solid model. RockWorks should append the .RwMod file name extension.
- Color Range Filter: Insert a check here to filter the input data based on color. (More info)
- Algorithm: This determines the modeling method to use, for creating a solid model from your irregularly-spaced drill hole color data. (More info)
- Special Options: Click on this tab to establish other model settings, such as tilting, warping, filtering above-ground, and smoothing. (More info)
- Use Existing Model: If you wish to use an already-existing color model for this profile diagram, click in this radio button.
- Solid Model: Browse for the name of the existing solid model (.RwMod file) to be used for this diagram.
- Output Grid
Click here to type in the name to assign the output grid (.RwGrd file) that will be created as a result of extracting a specific slice from the solid model. This grid model's nodes will be assigned the actual Windows color values interpolated for the data. (You'll choose the elevation level after setting up the menu options.)
- Slice Selection
Click here to define how you want to define the elevation location for the map.
- Select Interactively During Processing: Click here to have the program display a window, after you click the Continue button, where you can interactively select the elevation for the map slice.
- Preselect: Choose this to define the elevation in advance, and enter that elevation (in project units) into the prompt. If you are including this program in a Playlist or Command script, you'll need to pre-select the elevation.
- 2D Grid Map
Insert a check here to display the extracted grid as a map at this time.
Click here to set up how the output map should look.
- Colored Intervals: Insert a check here to include color bands to represent the color values. Use the options to the right to access the various options. (More info)
- Contour Lines: Check this box to include line contours. (More info)
- Other Map Layers
Use the remaining check-boxes to set up the other map layers (images, overlays, peripherals, etc.)
- Output Options: Use these settings to define whether the output graphic is to be saved (or displayed as "untitled"), how the file should be named, and whether it is to be displayed after it is created. It also offers export options. (More info)
Follow these steps to create a 2-dimensional map that displays the color zones that lie at a specific elevation:
- Access the RockWorks Borehole Manager program tab.
- Enter/import your data into the Borehole Manager, if you have not done so already. This tool specifically reads location, orientation (if any), and color data.
- Select the Borehole Operations | Colors | Plan Map menu option.
- Enter the requested program settings, described above
- Click the Continue button to proceed.
If you've selected Use Existing Model, the program will load the information from the existing color model (.RwMod file), and will proceed to diagram generation.
If you've selected Create New Model, the program will scan the project database and extract the XYZ points for all of the downhole color measurements. (For color data, the elevations will represent interval midpoints.) It will apply any source data filters you have requested.
- If you have chosen interactive slice selection, RockWorks will then display a window listing all of the elevation levels in the solid model. Choose the elevation to be represented in the plan-view map, and click OK.
RockWorks will use the selected algorithm to create a solid model of the downhole color data, storing the actual Windows color number as the "G" value in the model. The completed model will be stored on disk under the indicated file name.
The program will then read all of the voxels in the color model at the selected elevation, and store those colors in the output grid model. The program will then create the 2D color map using the requested diagram settings. The completed diagram will be displayed in a RockPlot2D tab in the Options window, if requested.
- You can adjust any of the program settings in the main Options pane to the left and then click the Continue button again to regenerate the plan map.
! If the color model looks OK and you just need to adjust one of the diagram settings, you don't need to keep re-interpolating the model. Choose Use Existing Model and browse for the color .RwMod file to be used for the map. This can save you a lot of time.
- View / save / manipulate / print / export the image in the RockPlot2D window.
- Double-click on the plan map in RockPlot2D to access the colorfill settings. There, you can adjust the minimum contour level, transparency, etc.
- Another way to view a horizontal slice within a solid model is via the Colors | Model option. Once the voxel block is displayed in RockPlot3D, access its Options window and insert a horizontal slice. This slice can be moved up/down interactively within the solid.
 Back to Colors Menu Summary

RockWare home page