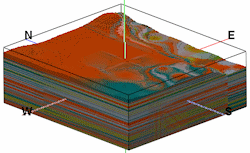
3D Solid: A 3D voxel display of the interpolated color model. (More info)
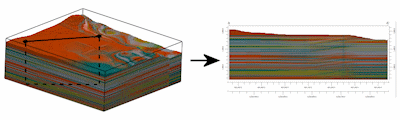
2D Profile: Create a profile diagram sliced between two points in the color model, with projected striplogs and color fills. (More info)
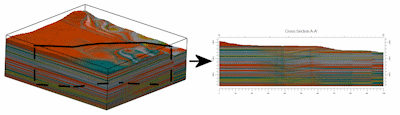
2D Multi-Panel Cross Section: Create a 2D multi-panel cross section, sliced between multiple points in the color model, with vertical striplogs at panel edges, and color fills. (More info)
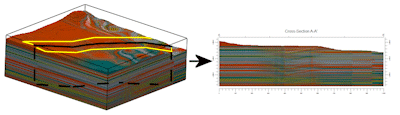
2D Multi-Panel Cross Section with Projected Logs: Create a 2D multi-panel cross section, sliced between multiple points in the color model, with striplogs projected onto panels, and color fills. (More info)
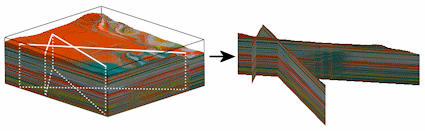
Fence: Create a 3D multi-panel fence diagram, sliced between multiple points in the color model, with 3D logs and and other layer options. (More info)
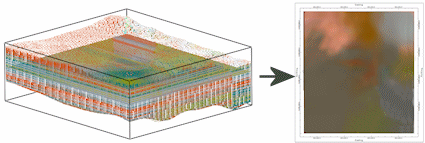
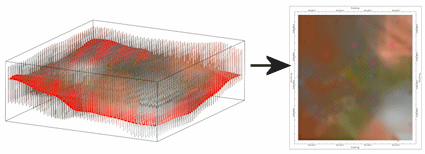
Surface Map: Create a 2-dimensional map of the colors extracted along a grid surface. (More info)
Plan Map: Create a 2-dimensional map of the colors extracted along a horizontal plane. (More info)