- Horizontal:
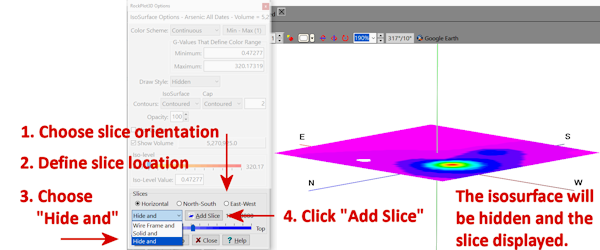
- To insert a horizontal slice, click in the Horizontal radio button. The slider bar will represent the base of the model to the left and the top of the model to the right. The elevation represented for any slider bar position is displayed in the window.
- Drag the slider bar until the desired elevation is displayed.
- Choose what is to happen with the voxel display as you insert the slice:
- Hidden And (Add slice): Choose this option from the drop-down list if the voxels are to be hidden when the slice is inserted. This is the default settings, and it allows you to actually see the slice inside the model.
- Solid And (Add slice): Choose this if the voxels are to remain displayed when the slice is inserted. Note that you will not be able to see the slice because it will be inside the model. You can later set the Draw Style to Hidden to render the slice(s) visible.
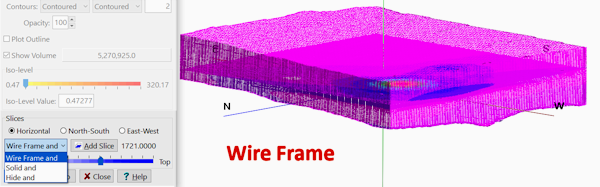
- Wire Frame And (Add slice): Choose this if the voxels are to be displayed using a wire frame when the slice is inserted.
- Points And (Add Slice): Choose this if the voxels are to be displayed as points when the slice is inserted. You can modify this later using the Draw Style setting.
- Click the Add Slice button to insert the slice. You should see the slice in the View pane, and the slice will be represented as a new item in the Data pane.
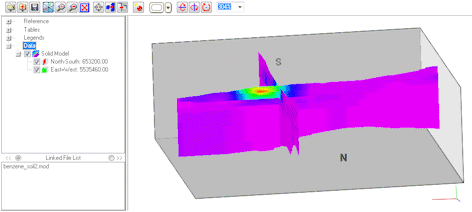
Here are some examples of the process of adding a horizontal slice, with hidden, wire frame, and solid isosurface displays.

- North-South:
- To insert a north-to-south vertical slice, click in the North-South radio button. The slider bar's left edge will represent the western boundary of the model, and the right edge will represent the eastern boundary of the model. The X coordinate represented for any slider bar position is displayed in the window.
- Drag the slider bar until the desired X coordinate is displayed.
- Click the Hide And or Wire Frame And or Solid And or Points And option, described above.
- Click the Add Slice button to insert the slice. You should see the slice in the View pane, and the slice will be represented as a new item in the Data pane.
- East-West:
- To insert an east-to-west vertical slice, click in the East-West radio button. The slider bar's left edge will represent the southern boundary of the model, and the right edge will represent the northern boundary of the model. The Y coordinate represented for any slider bar position is displayed in the window.
- Drag the slider bar until the desired Y coordinate is displayed.
- Click the Hide And or Wire Frame And or Solid And option, described above.
- Click the Add Slice button to insert the slice. You should see the slice in the View pane, and the slice will be represented as a new item in the Data pane.