Use this program to:
In other words, it creates a color-based geological map based on downhole data. The color model stores the actual Windows color for each node. The completed map is displayed in RockPlot2D.
See also
Color Model Plan Maps for simpler, horizontal slices through the color model at a user-specified elevation.
Feature Level: RockWorks Standard and higher
Menu Options
Step-by-Step Summary
Tips
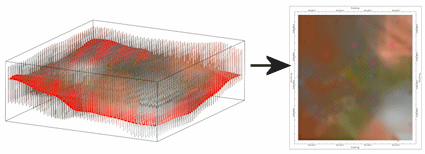
Follow these steps to create a 2-dimensional map that displays the color zones that intersect a surface model:
If you've selected Use Existing Model, the program will load the information from the existing color model (.RwMod file), and will proceed to diagram generation.
If you've selected Create New Model, the program will scan the project database and extract the XYZ points for all of the downhole color measurements.(For color data, the elevations will represent interval midpoints.) It will apply any source data filters you have requested.
RockWorks will use the selected algorithm to create a solid model of the downhole color data, storing the actual Windows color number as the "G" value in the model. The completed model will be stored on disk under the indicated file name.
The program will then load the specified Surface Topography Grid model. For each grid node, it will determine the color in the corresponding location in the solid model, and store that Windows color number in the output grid model. The program will then create the 2D color map using the requested diagram settings. The completed map will be displayed in a RockPlot2D tab in the Options window if requested.
! If the color model looks OK and you just need to adjust one of the diagram settings, you don't need to keep re-interpolating the model. Choose Use Existing Model and browse for the color .RwMod file to be used for the map.
![]() Back to Colors Menu Summary
Back to Colors Menu Summary
![]()