RockWorks | Borehole Operations | Aquifers | Plan Map
Use this program to:
- Interpolate grid models for the upper surface, lower surface, and thickness of a single aquifer listed for a particular date or date range in the Water Levels table, and
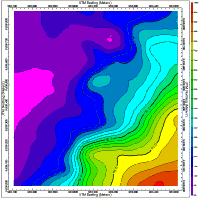
- Create a 2-dimensional (flat) contour map of the aquifer surface, base, or thickness.
Numerous modeling options are offered for creating the aquifer surface models. The grid models will be stored as .RwGrd files on disk. The completed contour map will be displayed in a RockPlot2D window.
Feature Level: RockWorks Standard and higher
Menu Options
Step-by-Step Summary
- Rules & Filters: Use the buttons at the top of the window to apply filters and rules for this program. (More info)
- Spatial Filter: Filter the input data for the aquifer model based on XYZ location. Note that these tools filter the data that is passed to the modeling procedures.
- Time Filter: Insert a check in this box at the top of the program window to filter the data based on date/time. If you have sampled aquifer levels on multiple dates, this is where you establish which dates are to be processed. Click this button to enter the filter settings. (More info)
- Choose Exact to enter a specific date for the data is to be processed. The date you enter here should match the date you entered into the Water Levels data tables.
- Click in the Range button if you want to process water level data for a range of dates, and then specify the starting and ending date and/or time for the data to be included in processing. (See Entering Water Level Data for details about how the dates are entered.)
! If you have multiple entries for a borehole for the selected date range, the program will include all of them when creating the model, in effect averaging them.
-
- Aquifer
Click this tab to select which aquifer is to be represented in the plan map.
- Map Type
Click here to select what the map is to represent:
- Superface (Top) Elevations: Map will illustrate the surface elevations of the aquifer.
- Subface (Base) Elevations: Map will illustrate the base elevations of the aquifer.
- Isopach (Thickness): Map ill illustrate the aquifer’s thickness.
- Modeling Options
Click this tab to establish the gridding method, the grid dimensions, and other gridding options.
- Dimensions: Use this tab to specify how the grid dimensions are to be established. Unless there's a specific reason to do otherwise, you should probably leave the grid dimensions set to the current project dimensions.
- Algorithms: Select a gridding method for the interpolation of the surfaces.
- Options: Establish the other general gridding options (declustering, logarithmic, high fidelity, etc.).
- 2D Grid Map
Insert a check here to display the extracted grid as a map at this time.
Click here to set up how the output map should look.
- Colored Intervals: Insert a check here to include color contours to represent the elevations or thickness. Use the options to the right to access the various options. (More info)
- Contour Lines: Check this box to display the elevations or isopach using line contours. (More info)
- Labeled Cells: Check this to include a map layer that displays the grid node values as labeled cells. (More info)
- Gradient Vectors: Check this to include a map layer that displays up or down-gradients with scalable arrows. (More info)
- Other Map Layers: Use the remaining check-boxes to set up the other map layers (images, overlays, peripherals, etc.).
- Output Options: Use these settings to define whether the output graphic is to be displayed after it is created and how/whether it is to be saved in a file in the project folder. (More info)
Follow these steps to create a 2-dimensional contour map of an aquifer surface, base, or thickness:
- Access the Borehole Manager program tab.
- Enter/import your data into the Borehole Manager, if you have not done so already. This tool specifically reads location, orientation (if any), and water level data.
- Enable boreholes: Be sure that all boreholes whose data are to be included in the aquifer surface or isopach grid are enabled.
- Select the Borehole Operations | Aquifers | Plan Map menu option.
- Enter the requested program settings, described above.
- Click on the Continue button to create the aquifer map.
The program will create a grid model of the aquifer's upper elevations, base elevations, and thickness using the selected gridding method. The grids will be named automatically using a "aquifername_date_top.RwGrd", "aquifername_date_base.RwGrd", and "aquifername_date_isopach.RwGrd" naming convention. The date portion of the file name should comply with the mm_dd_yyyy or dd_mm_yyyy date format as established in Windows.
RockWorks will then create the selected 2-dimensional top/base/thickness map with the selected layers. The completed diagram will be displayed in a RockPlot2D tab in the Options window.
- You can adjust any of the program settings in the main Options tab to the left, and then click the Continue button again to regenerate the map.
- View / save / manipulate / print / export the map in the RockPlot2D window.
 Back to Aquifers Menu Summary

RockWare home page