Borehole Operations | StripLogs | 3D Striplog
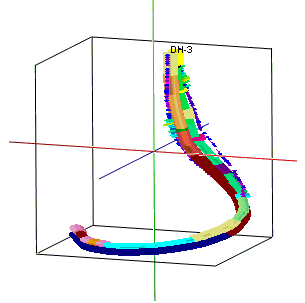
Use this program to create a three-dimensional view of the strip log of a single well, displaying observed data entered into the Borehole Manager data tables. The log can include any combination of the available log items. The completed image can be displayed in the RockPlot3D window.
Feature Level: RockWorks Basic and higher
Menu Options
Step-by-Step Summary
- Rules & Filters
Use the tabs at the top of the window to apply stratigraphic rules or time/date filters to data being displayed in your 3D log. (More info)
- 3D Log Design
Click on this tab at the top of the window to select the data to be displayed in the log.
- Visible Items: Use the check-boxes in the first pane to select which log items are to be displayed. See Visible Item Summary for information about the different log items.
- Options: Click on any of the Visible Items names to see the item's settings in the Options pane to the right. See the Visible Item Summary for links to the Options settings.
- Layout Preview: For each item you've activated, you'll see it represented by a color- and letter-coded circle in the upper Layout Preview pane. Click and drag any item to rearrange the log columns, and click and drag on a column's handles to resize the column. See Using the 3D Log Designer.
-
- Borehole ID
Click on this tab to choose the borehole to be displayed. This will default to the currently-selected borehole in the Borehole Manager program window; click on the drop-down list to choose a different borehole name as you wish.
- XYZ Clipping: Insert a check in this box if you want to display a subset of the log data. Click on this tab to define the elevation range to be displayed. (More info)
! Log clipping parameters are defined using elevations, not depths.
- Other 3D Diagram Options: Use these checkboxes to append other layers to your 3D scene. (Summary)
- Draped Image: Include an image in this 3D scene, draped over an existing grid surface. (More info)
- Floatimg Image: Include an image in this 3D scene, floating at a specified elevation. (More info)
- Perimeter Cage: Include a 3D reference cage around the diagram. (More info)
- Legends: Include one or more legends with the diagram.(More info)
- Infrastructure: Display buildings, pipes, or other infrastructure with your 3D scene. (More info)
- Faults: Include 3D fault ribbons with this scene. (More info)
- Other 3D Files: Include other, existing, RockPlot3D ".Rw3D" files in this scene. (More info)
-
- Output Options: Use these settings to define whether the output scene is to be saved (or displayed as "untitled"), how the file should be named, and whether it is to be displayed after it is created. It also offers export options. (More info)
- Access the Borehole Manager program tab.
- Enter/import your data into the Borehole Manager database if you have not already done so.
- In the list along the left side of the Borehole Manager window, click on the name of the borehole whose data is to be displayed in the log. Be sure the check-box to the left of the borehole name is checked so that the borehole is enabled.
- Select the StripLogs | 3D Striplog option from the Borehole Operations menu.
- Establish the program settings, as described above.
- Be sure to click on the 3D Log Design tab to establish the layout of the log diagram.
- Click on the Continue button to proceed.
The program will create a three-dimensional display of the selected borehole, reading the specified data from the borehole database. Only the log items you have activated will be displayed in the log. The log will be displayed in a RockPlot3D tab in the Options window if requested.
- You can adjust any of the settings in the Main Options tab to the left and click the Continue button to regenerate the log.
- View / save / manipulate / print / export the log in the RockPlot3D window.
 Back to StripLogs Menu Summary

RockWare home page


![]() Back to StripLogs Menu Summary
Back to StripLogs Menu Summary