Use the programs in the Borehole Operations | Striplogs menu to create 2D and 3D log diagrams, log cross sections and profiles, and downhole survey diagrams; to compute TD distance reports; to pick lithologic or stratigraphic data intervals via an interactive display, and to manipulate lithology or stratigraphy data.
![]() Back to Borehole Operations Summary
Back to Borehole Operations Summary
2D Striplog
Create a 2D strip log of a single well, including any combination of the available log items. The boring can be vertical, inclined, or deviated. (More info)
All Logs to PDF
Create a 2-dimensional strip log of all boreholes or enabled holes only, and output the logs directly to a single, multi-page PDF file. (More info)
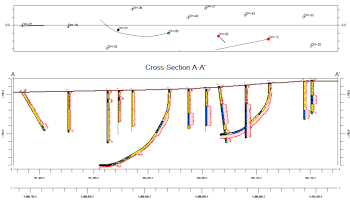
2D Striplog Profile
Create a 2D display of multiple strip logs, projected onto a single profile "slice", displayed as vertical, inclined, or deviated. (More info)
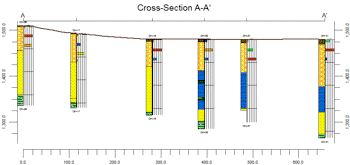
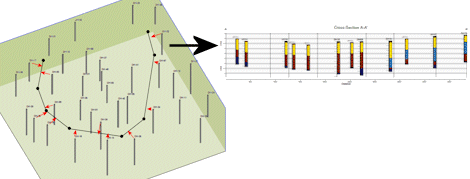
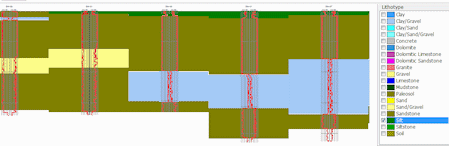
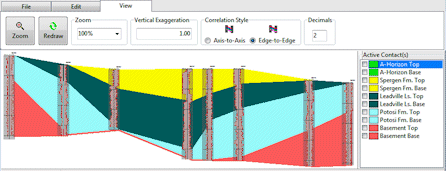
2D Striplog Section
Create a 2D vertical display of multiple strip logs, displayed as vertical only. This "hole to hole" section has a borehole at the end of each section "panel.". (More info)
2D Projected Log Section
Create a 2D vertical display of multiple strip logs, displayed as vertical only. Logs are projected onto multiple panel "slices". (More info)
3D Striplog
Create a 3D strip log of a single well, including any combination of the available log items; vertical, inclined, or deviated. (More info)
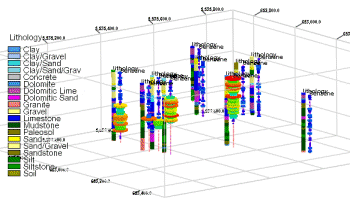
3D Striplogs
Create a 3D view of the logs of all enabled wells, including any combination of the available log items. The logs will be displayed at true orientation. (More info)
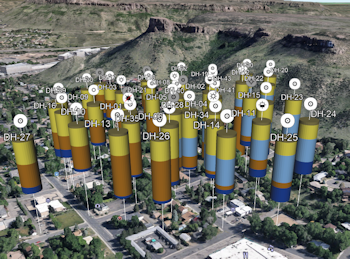
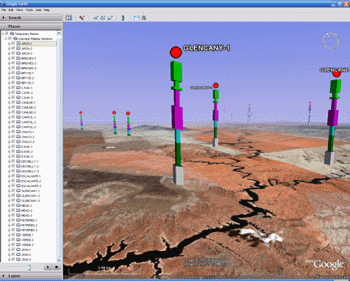
Google Earth Logs - Simple
Display stratigraphic data as vertical logs in Google Earth using default settings. (More info)
Google Earth Logs - Advanced
Display stratigraphic data as vertical logs in Google Earth with more display options. (More info)
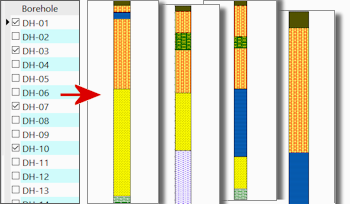
Lithology Picker
Display striplogs and pick material intervals, for posting to the database. (More info)
Stratigraphy Picker
Display striplogs and pick formation tops and bases, for posting to the database. (More info)
Endpoint Comparison
Generate a report of the spatial relationships for the borehole endpoints. (More info)
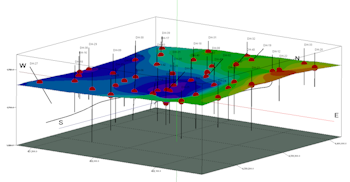
Surface Intersections
Generate a listing of intersections of boreholes and grid surfaces. (More info)
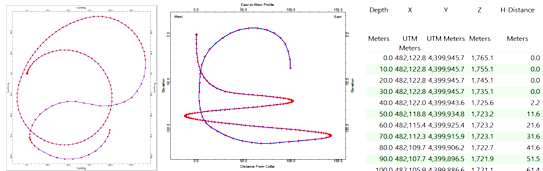
Borehole Survey
Read depths, bearings, and inclinations for the current borehole, from the Borehole Database, and create an XYZ Report, 2D and 3D Diagrams. (More info)
Datasheet -> Borehole Survey
Read depths, bearings, and inclinations from the RockWorks Datasheet, and create an XYZ Report, 2D and 3D Diagrams (More info)
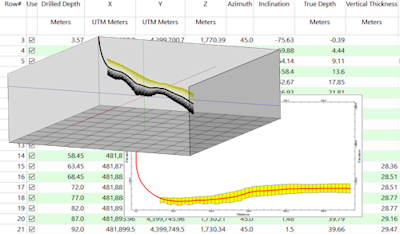
Payzone -> Optimum Path
Compute downhole survey measurements for an optimum well path, given a starting and ending point, payzone surfaces, and well settings, and create a survey report, an XYZ Report, and/or 2D and 3D Diagrams (More info)
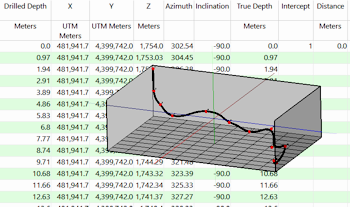
XYZ -> Optimum Path
Compute the optimum (least curvature) path for a polyline (e.g. well bore, tunnel) that passes through a series of xyz points or intercepts. Create a survey report, an XYZ Report, and/or 3D Diagram (More info)
Lateral Geo-Steering
The Planned Survey is based on data within the RockWorks Datasheet. The P-Data (e.g., resistivity, gamma, gas) is loaded from the Borehole Manager database. The survey points are plotted on the well path polylines. A new example project folder/database titled "Laterals" is included to illustrate how this program is used. The borehole database includes a single borehole that corresponds with a sample Planned Survey datasheet. (More info)
![]() Back to Borehole Operations Summary
Back to Borehole Operations Summary
![]()