RockWorks | ModOps | Solid | Filters | Geobody
Use this program to identify contiguous blocks of voxels that have the same, or close to the same, G-values. Example applications include:
- Hydrogeology: Delineate aquifers and aquitards within a lithologic model. A clay unit that overlies an aquifer may be essentially impermeable, but if it's not laterally contiguous the aquifer may not be "confined".
- Mining: Consider mineralization along a shear zone. The Continuity Filter can be used to identify the contiguous ore-grade zones like beads along a chain. Eliminating the sub-economic "beads" can assist in a the creation of a profitable extraction plan.
- Petroleum: By Continuity-Filtering a pay-zone, we can predict just how much of the zone can be effectively drained.
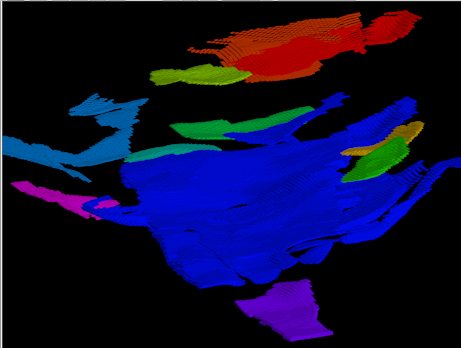
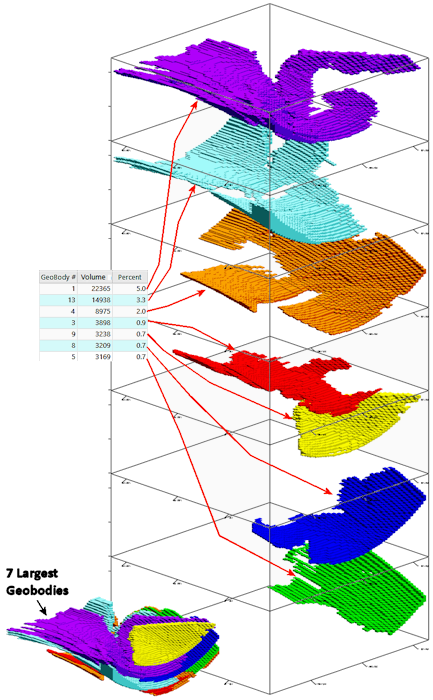
The program will output a new solid model with nodes (which fit within the user's defined G value range) reassigned with geobody numbers. Discontinuous blocks of nodes will be assigned different geobody numbers. A "Contiguous Units" report will list the separate geobodies with their assigned numbers, volumes, and percent of the volume of all of the geobodies.
Feature Level: RockWorks Basic and higher
Menu Options
Step-by-Step Summary
- Rules & Filters: Use the buttons at the top of the window to apply filters and rules for this program. (More info)
- Spatial Filter: Filter the input data to be displayed in striplogs, if activated.
- Time Filter: Filter any T-Data or Aquifer data in striplogs, if activated.
- Stratigraphic Rules: Apply stratigraphy rules for Stratigraphy data in striplogs, if activated.
- 3D Log Design
If you decide to include logs with this diagram ("Striplogs" setting, below), click on this button at the top of the window to set up how you want the 3D logs to look.
See Visible Item Summary and Using the 3D Log Designer for details.
- Input/Output Models
- Input Model: Click to the right to select the name of the existing RockWorks solid model file (*.RwMod) to be filtered.
- Output Model: Click to the right to type in the name to assign to the new solid model that the program will create, which results from the filtering operation.
- Cutoff Levels
- Minimum Value: Type in the minimum G value in the source model to be included in the output geobodies.
- Maximum Value: Type in the maximum G value in the source model to be included in the output geobodies.
For example, if porous lithotypes within a lithology model have been assigned "groupable" values (e.g. Sand=5, Gravelly Sand=6, Sandy Gravel=7, Gravel=8), then assigning the Minimum G-Value to 5.0 and the Maximum G-Value to 8.0 will identify geobodies (contiguous regions) composed of Sand, and/or Gravelly Sand, and/or Sandy Gravel, and/or Gravel.
- Remove Small Geobodies: Check this box if you want small geobodies to be removed from the output.
- Minimum % of Model Volume: Enter the percent of model volume below which will be considered a "small geobody" and removed from the output.
- 3D Solid Diagram
Insert a check here to display the output solid model as a 3D diagram.
Click this tab to set up the diagram options.
- Block Diagram
- Isosurface: Click in the Isosurface radio button to display the solid model as if enclosed in a "skin." This view will be smoother than a voxel display. (More info)
- Isomesh: Check this box to plot a series of polylines that represent three-dimensional contours at a user-defined cutoff. Click this tab to establish the settings. (More info)
- Voxels: Click in the Voxels radio button to represent the solid model in the 3D display as color-coded voxels. You can choose to display either the Full Voxel, or just the Midpoint. Display of the midpoint only can significantly improve display time for huge models.
- Filter: Check this option if you want to restrict the isosurface or voxel display to a specific data range. This does not affect the model, only the display of the model. Enabling this permits you to create an initial display in RockPlot3D that eliminates the need to manually change the display attributes. More importantly, this capability if essential for initially displaying the solid in a pre-filtered state when creating animations and Playlist scripts.
! These filter settings can be changed once the diagram is displayed in RockPlot3D.
- Color Scheme: Choose the color scheme for the block model - automatic, table-based, etc. (More info)
- Striplogs: Check this item to include 3D logs with the solid model display. Click the 3D Log Design button at the top of the window to set up how you want the logs to look.
- XYZ Clipping: Check this sub-item if you want to restrict the logs to a particular spatial area. (More info)
- Other 3D Solid Diagram Options: Use these checkboxes to append other layers to your 3D scene. (Summary)
- Draped Image: Include an image in this 3D scene, draped over an existing grid surface. (More info)
- Floating Image: Include an image in this 3D scene, floating at a specified elevation. (More info)
- Perimeter Cage Include a 3D reference cage around the solid diagram. (More info)
- Legends: Include one or more legends with the diagram.(More info)
- Infrastructure: Display buildings, pipes, or other infrastructure with your 3D scene. (More info)
- Faults: Include 3D fault ribbons with this scene. (More info)
- Other 3D Files: Include other, existing, RockPlot3D ".Rw3D" files in this scene. (More info)
- Output Options: Use these settings to define whether the output scene is to be saved (or displayed as "untitled"), how the file should be named, and whether it is to be displayed after it is created. It also offers export options. (More info)
- Select the ModOps | Solid | Filters | Continuity Filter menu option.
- Specify the menu settings, described above.
- Click the Continue button to proceed.
RockWorks will read the contents of the input solid model file and compare the value of each input node to the min-max value range defined above. It will then determine which of the included nodes are contiguous with other included nodes and group them within a single "geobody". Separate geobodies will be assigned sequential integer values ("1", "2", "3", etc.) in the order in which they are . The nodes in each resulting contiguous geobody will be re-assigned the geobody number. The resulting solid model file will be stored under the declared output file name. If you have requested a diagram, it will be displayed in a RockPlot3D tab. The Contiguous Units report will be displayed in a data tab.
- You can adjust any of the input settings using the main Options tab to the left, and click the Continue button again to regenerate the display.
- View / save / manipulate / print the image in the RockPlot3D window.
 Back to Solid Menu Summary

RockWare home page