RockWorks | ModOps | Solid | Logic | Maximum Waste
This program reads a Boolean model and allows you to remove small pockets of "non-ore" material from surrounding "ore" blocks, translating them to "ore" classification and including them in the output solid model for future calculations. (This is the same as the "interbed" filter within the Borehole Manager's I-Data Volumetrics option.)
Feature Level: RockWorks Basic and higher
Menu Options
Step-by-Step Summary
- 3D Log Design
If you decide to include logs with this diagram (3D Solid Diagram | Striplogs), click on this tab at the top of the window to set up how you want the 3D logs to look.
See Visible Item Summary and Using the 3D Log Designer for details.
- Rules & Filters
Use these tabs at the top of the window to apply spatial filters, time/date filters, or stratigraphic rules to data being displayed in your 3D striplogs. (More info)
- Input/Output Models
- Input Model: Click to the right to browse for the name of the existing Boolean solid model that the program is to read and filter.
! This must be a Boolean (not a real number) model. See the Applying a Boolean Filter to a Solid Model option for information.
- Output Model: Click to the right to type in the name to assign to the new Boolean solid model that the program will create, which results from the filtering operation.
- Constraining Surface: Insert a check in this box if the computations are to be only for solid model nodes that lie below a grid (usually representing ground) surface. You can leave this box un-checked if the computations can include all nodes to the top of the model.
- If activated, click to the right to browse for the name of the grid model that contains the elevations for the surface topography.
- ! This grid model must already exist, and it must have the same X, Y dimensions and node spacing as the Boolean model being filtered.

- Interbed Limits
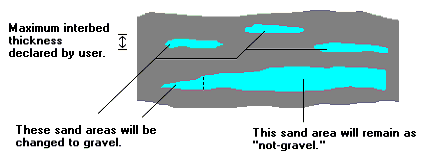
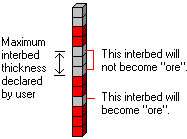
- Maximum Interbed Thickness: Here, type in the maximum thickness, in your depth or elevation units, to be considered as interbeds. Any contiguous "waste" voxels with a height less than this entry will be reassigned an "ore" classification and set to a value of "1".
- 3D Solid Diagram
Insert a check here to display the output solid model as a 3D diagram.
Click this tab to set up the diagram options.
- Block Diagram
- Isosurface: Click in the Isosurface radio button to display the solid model as if enclosed in a "skin." This view will be smoother than a voxel display. (More info)
- Isomesh: Check this box to plot a series of polylines that represent three-dimensional contours at a user-defined cutoff. Click this tab to establish the settings. (More info)
- Voxels: Click in the Voxels radio button to represent the solid model in the 3D display as color-coded voxels. You can choose to display either the Full Voxel, or just the Midpoint. Display of the midpoint only can significantly improve display time for huge models.
- Filter: Check this option if you want to restrict the isosurface or voxel display to a specific data range. This does not affect the model, only the display of the model. Enabling this permits you to create an initial display in RockPlot3D that eliminates the need to manually change the display attributes. More importantly, this capability if essential for initially displaying the solid in a pre-filtered state when creating animations and Playlist scripts.
! These filter settings can be changed once the diagram is displayed in RockPlot3D.
- Color Scheme: Choose the color scheme for the block model - automatic, table-based, etc. (More info)
- Striplogs: Check this item to include 3D logs with the solid model display. Click the 3D Log Design button at the top of the window to set up how you want the logs to look.
- XYZ Clipping: Check this sub-item if you want to restrict the logs to a particular spatial area. (More info)
- Other 3D Solid Diagram Options: Use these checkboxes to append other layers to your 3D scene. (Summary)
- Draped Image: Include an image in this 3D scene, draped over an existing grid surface. (More info)
- Floating Image: Include an image in this 3D scene, floating at a specified elevation. (More info)
- Perimeter Cage Include a 3D reference cage around the solid diagram. (More info)
- Legends: Include one or more legends with the diagram.(More info)
- Infrastructure: Display buildings, pipes, or other infrastructure with your 3D scene. (More info)
- Faults: Include 3D fault ribbons with this scene. (More info)
- Other 3D Files: Include other, existing, RockPlot3D ".Rw3D" files in this scene. (More info)
- Output Options: Use these settings to define whether the output scene is to be saved (or displayed as "untitled"), how the file should be named, and whether it is to be displayed after it is created. It also offers export options. (More info)
- Be sure you have an existing Boolean solid model already created, for input into this program.
- Select the ModOps | Solid | Logic | Maximum Waste menu option.
- Enter the requested menu settings, described above.
- Click the Continue button to proceed.
RockWorks will read the input Boolean solid model file. If requested it will determine which nodes fall below the input ground surface grid and use only those nodes in the computations. It will scan each vertical column of voxels within the model, and determine which areas are "interbeds" by locating "waste" nodes that lie between "ore" nodes.
It then determines the thickness or height of the contiguous interbed (waste) nodes. Those areas where the thickness falls below your threshold are changed from "waste" to "ore." Those interbed thickness areas greater than your threshold remain interbeds.The filtered model will be stored under the requested output file name. If you have requested a diagram, it will be displayed in a RockPlot3D tab.
- You can adjust any of the input options via the main Options tab to the left and then click the Continue button again to regenerate the model and display.
- View / save / manipulate / print the diagram in the RockPlot3D window.
 Back to Solid Menu Summary

RockWare home page