Borehole Operations | Maps | Optional Fields
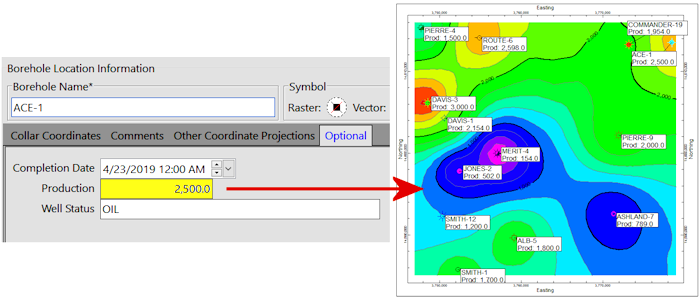
Use this program to create a grid model and 2-dimensional map of a numeric data field in your Location table. This is a handy way to create a contour map of data values such as production which are stored as optional fields in the Location table of the borehole database.
Feature Level: RockWorks Basic and higher
Menu Options
Step-by-Step Summary
- Rules & Filters
Use the buttons at the top of the window to apply spatial filters, time/date filters, or stratigraphic rules to data being displayed in your map. (More info)
- 3D Log Design
If you decide to include logs with this diagram ("Striplogs" setting, below), click on this button at the top of the window to set up how you want the 3D logs to look.
See Visible Item Summary and Using the 3D Log Designer for details.
- Input/Output
- Field to be Mapped: Click here to select the field in the Location table that contains the quantitative data you wish to grid and contour. This could be production values, thickness of producing formation - any quantitative value.
! This tool will only read Location fields which are set up as numeric fields (Integer or Floating Point).
-
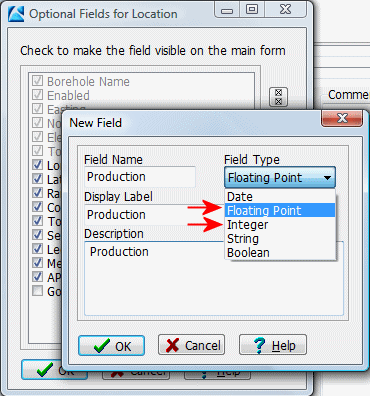
You cannot create a contour map from data stored in a date, string, or Boolean field. See Setting Up Optional Fields for Borehole Locations.
- Grid Name: Click here to type in a name for the grid model that will be interpolated from the above-selected data and which the contour map will represent.
- Gridding Method: Click on this button to access the various gridding options.
- Grid Dimensions: These options define the extents and node spacing of the output grid model. (More info)
- Algorithms: These settings define the gridding method that will be used to interpolate the grid model. (More info)
- Options: Use these settings to establish the other general gridding options (smoothing, etc.). (More info)
- 2D Grid Map
Check this box to display the grid model as a 2D map.
Click on this tab to turn on various map layers and establish the settings. See 2D Map Options for information.
- Output Options: Use these settings to define whether the output graphic is to be saved (or displayed as "untitled"), how the file should be named, and whether it is to be displayed after it is created. It also offers export options. (More info)
- 3D Grid Diagram
Check this box to display the grid model as a 3D surface.
Click on this tab to turn on various 3D layers and establish the settings. See 3D Surface Options for more information.
- Output Options: Use these settings to define whether the output scene is to be saved (or displayed as "untitled"), how the file should be named, and whether it is to be displayed after it is created. It also offers export options. (More info)
- Access the Borehole Manager program tab
- Enter/import your data into the Borehole Manager, as necessary. This tool specifically reads data stored in optional fields in your Location table. (More info
- Select the Maps | Optional Fields option from the Borehole Operations menu.
- Enter the program settings as described above.
- Click the Continue button to create the map.
The program will interpolate a grid model for the data stored in the selected field.
If requested, it will create a 2-dimensional map containing the requested map layers. The map will be displayed in a RockPlot2D tab in the options window.
If requested, it will create a 3-dimensional map containing the reqested layers. The surface will be displayed in a RockPlot3D tab in the options window.
- You can adjust any of the settings using the main Options tab to the left and click the Continue button again to regenerate the grid model and map.
- View / save / manipulate / print / export the map in the RockPlot2D window and/or the RockPlot3D window.
 Back to Map Menu - Summary

RockWare home page