RockWorks | Borehole Manager | Fractures | Stereonet
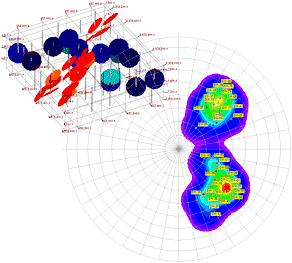
This program is used to plot a stereonet depicting the fractures for all enabled boreholes. The collage above shows how fractures are displayed within a 3-dimensional striplog diagram versus a contoured stereonet for the same boreholes.
These options are very similar to those in the Utilities | Planes | Stereonet program, with the following exceptions:
- The program assumes that the downhole fracture data represent planes.
- The program assumes that the downhole fracture data is recorded in dip-direction parlance. This limitation is designed to maintain compatibility with the other programs that read the downhole fracture data (e.g. striplogs and fracture modeling).
- The Symbols option allows the user to either set uniform symbols (i.e. all the same), or symbols that are defined within the borehole location tab.
- The Labels option will automatically assign the borehole title as the point label. Many other additional options are included, including the automatic-offset capability.
See also
Stereonet Maps
Feature Level: RockWorks Standard and higher
Menu Options
Step-by-Step Summary
- Stereonet Options (See the Details topic for more information about these stereonet-specific settings)
- Directionality: Enter any magnetic declination correction here.
- Projection: Determines how points are to be projected on the stereonet plot, as an equal angle or Wulff projection, or as an equal area or Schmidt projection. A lower hemisphere projection is used for both types.
! NOTE Stereonet contours (activated below) are based on point distributions within a Schmidt projection (equal area) diagram. If you plot points on a Wulff stereonet AND include contours, you may note that the point densities and contours might not correspond.
- Symbols: Insert a check here to activate the plotting of symbols on the stereonet. The symbols will represent the point of intersection of the poles to the planes.
- Raster Symbols: Check this item to represent the points on the stereonet with raster symbols.
- Size: Defined as percent of diagram size.
- Type
- Use Borehole Raster Symbols: Choose this option if the raster symbol listed in each borehole's Location tab should be used in the stereonet plot.
- Uniform: Choose this option if all of the symbols are to be the same. Click on the sample to select the raster symbol style.
- Vector Symbols: Check this item to represent the points on the stereonet with vector symbols. You can plot both raster and vector symbols.
- Size: Defined as percent of diagram size.
- Type
- Use Borehole Vector Symbols: Choose this option if the vector symbol listed in each borehole's Location tab should be used in the stereonet plot.
- Uniform: Choose this option if all of the symbols are to be the same. Click on the sample to select the vector symbol style.
- Labels: Insert a check here to turn on the plotting of labels for each point in the stereonet. Click this tab to access the label settings. Note that the label text will be limited to the borehole ID.
- Color Contours: Check this to activate the plotting of color-filled intervals to represent point density on the diagram. Click this tab to access the colorfill settings. As with the line contours, above, the color intervals will be drawn based on a program-computed grid model.
- Contours: Check this to activate the plotting of line contours on the diagram to represent point density. Click the tab to access the contouring settings. If you request contours, they will be drawn based on a program-computed grid model; be sure you establish the Gridding Options (see below).
- Gridding Options: Click this tab to establish how the point densities are to be computed if either line or color-filled contours have been requested on the stereonet plot. The program uses a process of "gridding" to compute point densities, in a manner similar to the gridding process for creating maps. The methods used to extrapolate the grid node values in a stereonet differ from the methods used in mapping, however. For "basic" gridding, you might select the Step Function method, with density units in Percent. See Stereonet Gridding Options for a lengthy explanation.
! Note Stereonet contours are based on point distributions within a Schmidt projection (equal area) diagram. If you plot points on a Wulff stereonet AND include contours, you may note that the point densities and contours might not correspond.
- Title: Check this to activate the plotting of a diagram title, and enter the text, color, size, and position.
- Statistics : Check this item to plot a statistical legend for the data. Click this tab to establish the legend settings. (More info) (See also the Statistical Summary.)
- Extras
- Great Circles: Use this check-box and it settings to activate the plotting of planar data as great circles. Select the line styles.
- Mean Lineation Vector: Check this item to plot the mean lineation vector. Select a symbol to represent it on the plot, and the label
- Best Fit Circle: Check this item to activate the plotting of the program-computed best-fit great circle on the stereonet. Select its line style and color.
- Background: Use this tab to turn on and off a variety of reference lines, ticks, and labels. (More info)
- Other 2D Diagram Options
Use these checkboxes to append other layers to your diagram.
Click each tab to set up the 2D diagram layers.
- Other 2D Files: Append other saved Rockplot2D diagrams
- Peripherals: Add a logo, title block, or other peripheral items to your diagram.
- Border: Include a solid-line border around the entire diagram.
- Output Options
Use these settings to define whether the output graphic is to be displayed after it is created and how/whether it is to be saved in a file in the project folder. (More info)
- Access the RockWorks Borehole Manager program tab.
- Enter/import your fracture data if you have not done so already.
- Be sure all of the boreholes whose fractures are to be included in the diagram are shown as enabled.
- Select the Borehole Operations | Fractures | Stereonet menu option.
- Enter the requested program settings, described above.
- Click the Continue button to proceed.
The program will generate a stereonet diagram that depicts the 3D orientations of all of the fractures. The diagram will be displayed in a RockPlot2D tab in the Options window if requested.
- You can adjust any of the program settings in the main Options tab to the left and click the Continue button to regenerate the diagram.
- View / save / manipulate / print / export the diagram in the RockPlot2D window.
 Back to Fracture Menu Summary

RockWare home page