RockWorks | Borehole Operations | Fractures | Stereonet Map
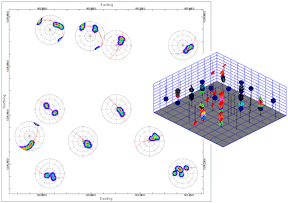
This program is used to plot a map with stereonets of downhole fractures centered over each borehole location. The above collage shows how fractures are displayed within a 3-dimensional striplog diagram versus a stereonet map.
These options are very similar to those in the Planes | Stereonet program in the RockWorks Utilities, with the following exceptions:
- The program assumes that the downhole fracture data represent planes.
- The program assumes that the downhole fracture data is recorded in dip-direction parlance. This limitation is designed to maintain compatibility with the other programs that read the downhole fracture data (e.g. striplogs and fracture modeling).
- The Symbols option allows the user to either set uniform symbols (i.e. all the same), or symbols that are defined within the borehole location tab.
- The Labels option will automatically assign the borehole title as the point label. Many other additional options are included, including the automatic-offset capability.
See also
Single Stereonets
Feature Level: RockWorks Standard and higher
Menu Options
Step-by-Step Summary
- Rules & Filters: Use the buttons at the top of the window to apply filters and rules for this program. (More info)
- Spatial Filter: Filter the input data for the map based on XYZ location.
- Time Filter: Filter any T-Data or Aquifer data in borehole location map labels, if activated.
-
- Stereonet (See the Details topic for more information about these stereonet-specific settings)
- Minimum Number of Fractures: This setting defines how the program will handle boreholes that either contain no fractures or not enough fractures to generate a contoured net. Specifically:
- A setting of 0 will plot the radial/concentric background grids for all boreholes, even if they have no fracture data.
- A setting of 1 will omit nets for boreholes that don't have at least one fracture. If a borehole contains less than three fractures, the radial/concentric background grid will be plotted along with symbols depicting the projected fracture points.
- A setting of 3 will only plot the contourable nets.
- Stereonet Dimensions: Use these settings to define the size of the stereonets, as a percent of the project size. (Default = 10) The program creates stereonet maps by rescaling individual diagrams and centering them on the borehole collar locations. Since the diagrams are typically circular (assuming that the statistical legend has been disabled), the x and y dimensions should be set to the same value. If your diagrams contain additional information (e.g. titles, color legends, statistical summaries, etc.), you will need to experiment with x/y settings that produce circular diagrams.
- Directionality
- Declination
- Magnetic Declination Correction: Enter any declinaton correction as described in the program dialog.
- Projection: Determines how points are to be projected on the stereonet plot, as an equal angle or Wulff projection, or as an equal area or Schmidt projection. A lower hemisphere projection is used for both types.
! NOTE Stereonet contours (activated below) are based on point distributions within a Schmidt projection (equal area) diagram. If you plot points on a Wulff stereonet AND include contours, you may note that the point densities and contours might not correspond.
- Color Contours: Check this to activate the plotting of color-filled intervals to represent point density on the diagram and establish the colorfill settings to the right. If you request contours, they will be drawn based on a program-computed grid model; be sure you establish the Gridding Options (see below).
- Contour Lines: Check this to include line contours on the diagram to represent point density and establish the contouring settings to the right. As with the color contours, above, the lines will be drawn based on a program-computed grid model.
- Gridding Options: Click this tab to establish the gridding method and density units if either line or color-filled contours have been requested on the stereonet plot. For "basic" gridding, you might select the Step Function method, with density units in Percent. See Stereonet Gridding Options for a lengthy explanation.
! Note Stereonet contours are based on point distributions within a Schmidt projection (equal area) diagram. If you plot points on a Wulff stereonet AND include contours, you may note that the point densities and contours might not correspond.
- Title: Check this to activate the plotting of a title on each stereonet, and click on the tab to enter the text, color, size, and position.
- Statistics: Check this to plot a statistical legend for the data. Select text size and color. (See the Statistical Summary.) For stereonet maps, this is probably best left disabled since it will be scaled so small that it will be difficult to read. (More info)
- Extras: Use this tab to access settings for plotting Great Circles, Mean Lineation Vector, and Best Fit Great Circle. (More info)
- Background: Click this tab to turn on and off a variety of reference lines, ticks, and labels. (More info)
- 2D Map Options Use the Background Image -> Border checkboxes to append other layers to your map.
Click each tab to set up the 2D map layers (bitmap, symbols and labels, map peripherals, map border, etc.).
- Output Options
Use these settings to define whether the output graphic is to be displayed after it is created and how/whether it is to be saved in a file in the project folder. (More info)
- Access the RockWorks Borehole Manager program tab.
- Enter/import your fracture data if you have not done so already.
- Enable the boreholes whose fracture data are to be represented in the map.
- Select the Borehole Operations | Fractures | Stereonet Map menu option.
- Enter the requested program settings, described above.
- Click the Continue button to proceed.
For each borehole, the program will generate a stereonet diagram that depicts the 3D orientations of the fractures. It will build a map of these diagrams, placing the stereonet center at the borehole location. The completed map will be displayed in a RockPlot2D tab in the Options window if requested.
- You can adjust any of the program settings in the main Options tab to the left and click the Continue button to regenerate the map.
- View / save / manipulate / print / export the map in the RockPlot2D window.
 Back to Fracture Menu Summary

RockWare home page