RockWorks | Borehole Operations | Colors | Imagery -> Colors
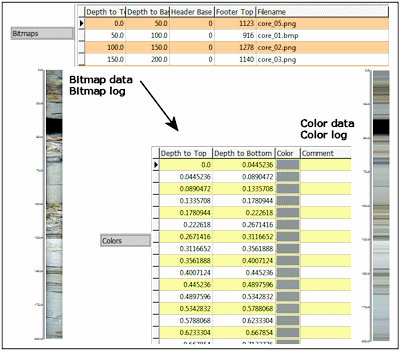
Use this program to extract color intervals from raster images stored in the Bitmaps table in the project database. It does this by scanning the images and averaging the colors for each depth interval into a single number. You can control the resolution of the image color sampling.
Once the colors have been recorded, they can be displayed in logs and interpolated into solid color models.
Some considerations:
- This tool requires that the raster images already be depth-registered.
- Images should be cropped such that only the uniformly illuminated regions will be scanned. For example, core images are commonly shadowed along the margins because the light source (flash) is typically located directly above the lens. Limiting the image to the most uniformly illuminated region will result in optimal color interpretation.
Feature Level: RockWorks Standard and higher
Menu Options
Step-by-Step Summary
- Boreholes
- Boreholes to include
- All Boreholes (Enabled and Disabled): The color data (stored within the Colors table) for all boreholes will be erased and replaced by the averaged colors from the associated raster images (as defined within the Bitmaps table).
- Only Enabled Boreholes: Process the data for only those boreholes which are enabled in the database.
- Currently Highlighted Borehole (Single Borehole): The color data (stored within the Colors table) for the currently selected borehole will be erased and replaced by the averaged colors from the associated raster images (as defined within the Bitmaps table).
- Sampling Intervals: There are two ways to sample and convert the raster information to color information:
- All Data (Highest Resolution): This option will compute the height represented by each row of pixels within the raster image. The average color for each row will then be stored within the Colors table. Be warned that if you have high-resolution images, this can create a lot of color intervals.
- User-Specified Intervals: This option will compute the average color within rectangular regions (as specified by the designated sampling interval) and store the results within the Colors table. For example, if the "Sampling Interval" is set to 5.0, the program will start by sampling all the pixels that fill within a depth range from zero to five meters. The average color will be stored as Depth to Top = 0, Depth to Base = 5, Color = Average For Interval (storing the Windows color number).
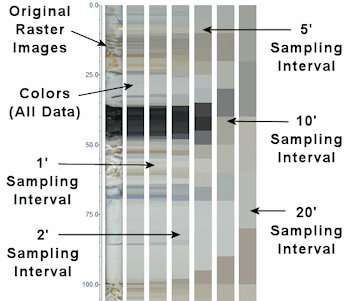
Here's an example of the effect of some different sampling intervals on a 200-foot log. Note that as the sampling interval is increased, the data becomes less useful, depending upon the vertical color variability.
Follow these steps to sample and record color data from existing raster images:
- Access the RockWorks Borehole Manager program tab.
- Enter/import your data into the Borehole Manager, if you have not done so already. This tool specifically reads data from the Location and Bitmap tables.
- Select borehole(s): If you intend to import data for one borehole only, or for enabled holes only, be sure that those hole(s) are selected or enabled. You should also be sure that there is one or more raster image files listed for these boreholes (Bitmaps datasheet), depth-registered.
- Select the Borehole Operations | Colors | Imagery -> Colors menu option.
- Enter the requested program settings, described above
- Click on the Continue button to proceed.
Rockworks will scan the raster image(s) and extract the average colors for the specified depth increments, recording the depths and colors in the Colors table in the borehole database.
 Back to Colors Menu Summary

RockWare home page