Use the programs in the Borehole Operations Production menu to read well production data from the database and generate 2D and 3D diagrams.
Feature Level: RockWorks Advanced
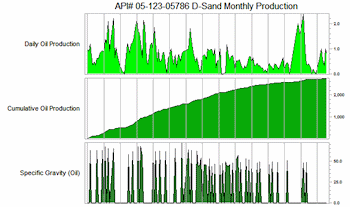
Single Well Diagram: Generate a variety of 2D production graphs for a single well. (More info)
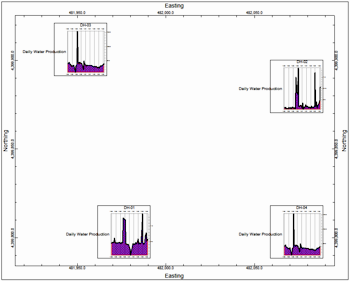
Graph Maps: Create a map display of 2D production graphs for enabled wells. (More info)
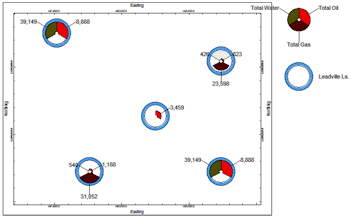
Proportional Symbol Maps: Create a map display of one or many production parameters shown as scaled symbols. (More info)
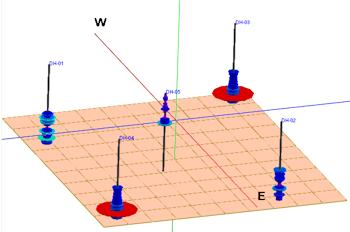
3D Well Production Diagrams: Create a 3D display of a selected production measurement using scaled disks. (More info)
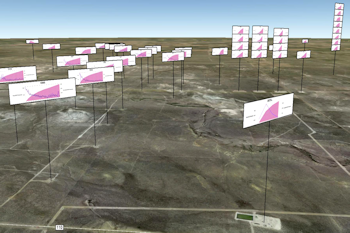
Production Billboards: Display 2D production graphs in vertical "billboards" in Google Earth. (More info)
![]() Back to Borehole Operations Summary
Back to Borehole Operations Summary
![]()