Borehole Operations | Maps | Striplog Map
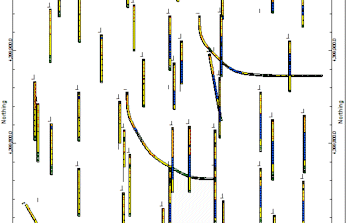
Use this program to create maps in which mini-striplogs, displaying user-selected columns, are plotted adjacent to the borehole location. You can vary the relative scaling of the logs as well as the offset relative to the borehole location symbol.
! The logs for deviated holes will be plotted as "unwound".
See also
Plan-View striplog maps for a map view of logs as projected onto a horizontal plane
Feature Level: RockWorks Basic and higher
Menu Options
Step-by-Step Instructions
- Rules & Filters
Use the buttons at the top of the window to apply spatial filters, time/date filters, or stratigraphic rules to data being displayed in your map. (More info)
- 2D Log Design:
Click on this button at the top of the window to set up how you want the logs in the map to look.
- Visible Items: Use the check-boxes in the first pane to select which log items are to be displayed. See Visible Item Summary for information about the different log items.
- Options: Click on any of the Visible Items names to see the item's settings in the Options pane to the right. See the Visible Item Summary for links to the Options settings.
- Layout Preview: For each item you've activated, you'll see a preview cartoon in the upper pane. Click and drag any item to the left or right to rearrange the log columns. See Using the 2D Log Designer.
-
- Log Map
- Scaling: The X and Y scaling provide a means for adjusting the relative sizes of the logs:
- To increase the relative width, increase the X-Scalar.
- To decrease the relative width, decrease the X-Scalar
- To increase the relative height, increase the Y-Scalar.
- To decrease the relative height, decrease the Y-Scalar.
- Note: Non-vertical logs will be distorted if the x-scalar does not equal the y-scalar.
- Offset: The offset refers to the distance between the borehole location and the top of the log. The offset represents a percentage of the project size (e.g. 1 = 1% of the distance from the southwest corner of the project area to the northeast corner of the project area).
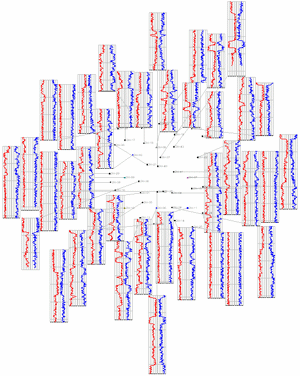
- Leader Lines: If selected, lines will be plotted from the borehole location to the log.
- Auto-Offset: This feature will automatically re-position the logs so they do not overplot adjacent borehole locations and other logs.
- Note that the automatic offsetting can become obnoxious if the logs are too large (e.g. leader lines crisscrossing the project area). Some experimentation may be necessary in order to gain the optimal output (i.e. the largest logs with the least amount of offset).
-
- Clip: Insert a check here to restrict the logs to a specific elevation range. This can be helpful if you have a deep project and only want to highlight log data for a limited interval.
- Top Elevation: Click here to type in the uppermost elevation to be included in the logs. Note that you are entering ELEVATION here, not depth.
- Base Elevation: Type in the lowest elevation to be included in the logs.
-
- 2D Map Options
Use these checkboxes to append other layers to your map.
Click each tab to set up the 2D map layers (image, map peripherals, map border, etc.).
- Output Options: Use these settings to define whether the output graphic is to be saved (or displayed as "untitled"), how the file should be named, and whether it is to be displayed after it is created. It also offers export options. (More info)
- Access the Borehole Manager program tab.
- Enter/import your data into the Borehole Manager database.
- Enable boreholes: In the list along the left side of the Borehole Manager window, be sure the boreholes you want to include in the map are checked or enabled.
- Select the Maps | Striplog Map option from the Borehole Operations menu.
- Enter the requested program settings, described above.
- Click on the Continue button to create the striplog map.
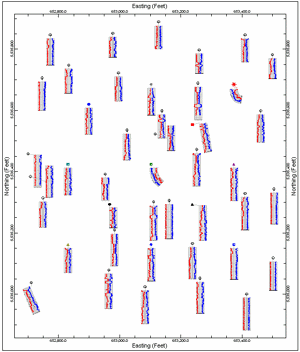
The program will create a borehole location map including mini-logs of the active boreholes. Any additional diagram settings that you requested will be included. If requested, the map will be displayed in a RockPlot2D tab in the Options window.
- You can adjust any of the settings in the Options tab and then click the Continue button again to regenerate the map.
- View / save / manipulate / print / export the map in the RockPlot2D window.
 Back to Map Menu - Summary

RockWare home page