RockWorks | Utilities | 3-D | Triangulation Surface
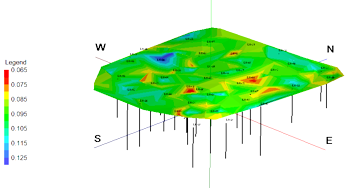
This program is used to build 3-dimensional surface maps for data listings with X, Y, Z coordinate points and a measured "G" value, as read from the current datasheet. Color contours will be drawn using the Delaunay Contouring method, they are not based on an interpolated grid model. Additional map layers include point symbols, imagery, reference coordinates, and more.
! For 2D triangulation-based maps, see the Utilities | Maps | Triangulation Contours program.
! For maps and 3D surfaces based on grid models, see the Grid | Create | XYZ - Grid program.
Menu Options
Step-by-Step Summary
- Data Columns
Click this tab to define the datasheet input columns.
- X (Easting): Select the name of the column in the main datasheet that contains the X or Easting coordinates.
These can be Eastings in meters or feet, decimal longitudes, etc. See Defining your Datasheet Coordinates for more information.
- Y (Northing): Select the column that contains the Y or Northing coordinates.
- Z (Elevation): Select the column that contains the Z or elevation values for the input points.
- Magnitude (G): Select the column that contains the measured value to be contoured.
- Duplicates: Use these settings to tell the program what to do if there are duplicate points at the same XYZ location.
- Duplicates
- Use Minimum Value: Choose this option for the program to pick the point with the lowest G value.
- Use Maximum Value: Choose this option for the program to pick the point with the highest G value.
- Use Value at Lowest Elevation: Choose this option for the program to pick the point with the lowest Z (elevation) value.
- Use Value at Highest Elevation: Choose this option for the program to pick the point with the highest Z (elevation) value.
- Use Average Value % Elevation: Choose this option for the program to average the G values and/or Z elevations.
- Display Triangulation Network: Check this option to include the Delaunay triangulation network with lines in the color that you choose.
- Color Scheme: Click this tab to access the color-contour options.
- G Filter: Insert a check here to filter the input data to be contoured based on the measured G Values. Click on the tab to set up the G Value Filter.
- Decimation Interval: Click this tab to define how the input points are to be sampled or "decimated". This provides a means for "thinning" the data by processing input points at a user-specified interval. For example, a Decimation Interval of 1 will process all input points while a Decimation Interval of 10 will process every tenth row.
- Other 3D Diagram Options
Use these checkboxes to append other layers to your 3D scene.
Click each tab to set up the 3D diagram layers (images, infrastructure, reference cage, etc.).
- Output Options
- Save Output File: Check this to assign a name for the 3D scene in advance, rather than displaying it as Untitled.
- Automatic: Choose this option to have RockWorks assign the name automatically. It will use the name of the current program plus a numeric suffix, plus the ".Rw3D" file name extension.
- Manual: Choose this option to type in a name of your own for this RockPlot3D file.
- Display Output: Check this option to have the resulting log displayed in RockPlot3D once it is created.
- Access the RockWorks Datasheet program tab.
- Create a new datasheet and enter or import the location coordinates and G-value column to be contoured. (More info)
Or, open one of the sample files and replace that data with your own.
! Click the Example button to the left to load a sample file that is installed with the program.
- Select the Utilities | 3-D | Triangulation Surface menu option.
- Establish the menu settings as described above.
- Click the Process button to create the 3D map.
The program will create the 3D contour panels with the selected layers, and display the scene in a RockPlot3D tab in the Options window.
- You can adjust any of the mapping options along the left and click the Process button to regenerate the surface.
- View / save / manipulate / print / export the map in the RockPlot3D window.
 Back to 3-D Menu Summary

RockWare home page