RockWorks | Borehole Operations | Maps | Borehole Map
Use the Borehole Map program to create a plan view map of your borehole locations with optional borehole surface contours. Many other map layers are also available.
! Tip: use the borehole surface grid model as a surface filter for your solid models.
Feature Level: RockWorks Basic and higher
Menu Options
Step-by-Step Summary
- Rules & Filters
Use the buttons at the top of the window to apply spatial filters, time/date filters, or stratigraphic rules to data being displayed in your map. (More info)
- Symbol Options
Click on this tab to establish the settings for the map symbols, labels, and borehole traces. Many labeling options are available. See Borehole Symbol + Label Options for details.
- Surface Contours
Check this option to interpolate a grid model that represents the borehole surface elevations and to create a color-filled or line contour map.
Click on this tab to establish the grid and map settings.
- Surface: Click here to enter the name for the grid file that will contain the model for the surface elevations. You can also select an existing grid model.
- Create New Grid: Click in this button if you want a new grid model to be generated to represent the borehole surface elevations. Click to the right to type in a name for the grid model (.RwGrd file).
- Use Existing Grid: Click in this button if you want to use an existing grid model for the ground surface contours. Click to the right to browse for the name of the grid model (.RwGrd file) to be used.
- Dimensions: Click here to review the dimensions for the surface grid. (More info)
- Algorithm: Click here to select the gridding method for the surface grid. (More info)
- Options: Click here to activate other gridding options. (More info)
- Display: Click here to set up the output contour map.
- Colored Intervals: Display the borehole surface grid with color-filled contours. (More info)
- Contour Lines: Check this to display the borehole surface grid with line contours. (More info)
- Labeled Cells: Check this to display the borehole surface grid as labeled cells. (More info)
- Gradient Vectors: Check this to display the borehole surface grid with up/down gradient vectors. (More info)
-
- 2D Map Options
Use these checkboxes to append other layers to your map.
Click each tab to set up the 2D map layers (image, map peripherals, map border, etc.).
- Output Options: Use these settings to define whether the output scene is to be saved (or displayed as "untitled"), how the file should be named, and whether it is to be displayed after it is created. It also offers export options. (More info)
- Access the Borehole Manager program tab.
- Enter/import your data into the Borehole Manager, as necessary.
- Select the Maps | Borehole Symbols option from the Borehole Operations menu.
- Enter the program settings as described above.
- Click the Continue button to create the map.
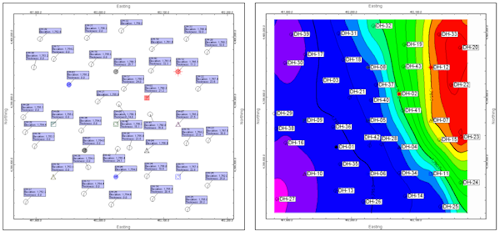
The program will create a 2-dimensional map of the well locations, reading the location information and symbol style from the Location table. Requested labels will be pulled from their respective data tables. Log traces, if included, will be computed from the downhole survey data in the Orientation table.
If you requested surface contours, the program will create a grid model of the borehole elevations listed in the Locations table, or read an existing grid model, and display these elevations with line and/or color-filled contours as requested. Other map layers will be appended as requested. The resulting map will be displayed in a RockPlot2D tab in the program window.
- You can adjust any of the settings in the Options tab to the left and click the Continue button again to regenerate the grid model and/or map.
- View / save / manipulate / print / append / export the map in the RockPlot2D window.
 Back to Map menu - Summary

RockWare home page