RockWorks | ModOps | Solid | Create | Fractures -> Solid
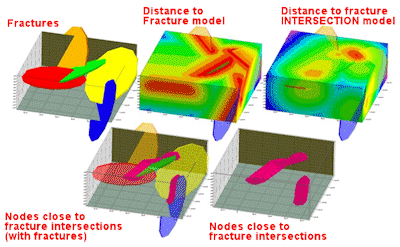
This program is used to create a solid model from fracture locations, assigning voxel values based on the distance between a voxel node and the closest point on the closest disk, or between the voxel and the closest fracture intersection. These disks are meant to represent fractures. This is the same tools as in the Borehole Manager Fractures | Model option, but reads the measurements from the program datasheet.
Possible applications include:
- Hydrology: Fractured Aquifers
- Mining: Hydrothermal Conduits
- Petroleum: Fractured Reservoirs
- Geotechnical: Site Excavations / Slope Stability
Feature Level: RockWorks Basic and higher
Menu Options
Step-by-Step Summary
- Rules & Filters: Use the buttons at the top of the window to apply filters and rules for this program. (More info)
- Spatial Filter: Filter the input data for the solid model based on XYZ location, filter the data to be displayed in striplogs, if activated. Note that these tools filter the data that is passed to the modeling and log-generating procedures. This is distinct from the filters that are applied once the model is completed, and described below.
- Time Filter: Filter any T-Data or Aquifer data in striplogs, if activated.
- Stratigraphic Rules: Apply stratigraphy rules for Stratigraphy data in striplogs, if activated.
- 3D Log Design
If you decide to include logs with this diagram ("Striplogs" setting, below), click on this button at the top of the window to set up how you want the 3D logs to look.
See Visible Item Summary and Using the 3D Log Designer for details.
- Data Columns: Use these prompts to define the input data for modeling.
- X-Column: Defines the datasheet column that contains the easting coordinates at the center of the fracture disks.
! The coordinates can be in the project coordinate system or another system. See Defining your Datasheet Coordinates for more information.
- Y-Column: Defines the datasheet column that contains the northing coordinates at the center of the fracture disks.
- Z-Column: Defines the datasheet column that contains the elevations at the center of the fracture disks.
- Direction Column: Defines the datasheet column that contains the dip-directions for the fracture disks.
- Dip Angle Column: Defines the datasheet column that contains the dip-angles for the fracture disks.
- Radius Column: Defines the datasheet column that contains the radii for the fracture disks.
- Model: First, tell the program whether you wish to use an existing solid model (from a previous use of this program or a Fractures menu program) or you wish to create a new solid model, by clicking in the appropriate radio button.
! NOTE This is not trivial. Creating the solid model can take some time, depending on the resolution of the model and the detail of your data. If you already created a pleasing model, you can use the same model, which was stored in your project folder as an .RwMod file, for the solid or isosurface.
- Create New Model: If want to create a new model, click in this radio button, and use the tabs to the right to establish the modeling settings.
- Solid To Be Created: Click to the right to enter a name for the solid model. RockWorks should appen the .RwMod file name extension.
- Modeling Method: Use these settings to define the type of frature model to be created:
- Distance to Closest Fracture: This algorithm assigns block model node values that represent the distance to the closest fracture.
- Distance to Closest Fracture Intersection (Very Slow): This algorithm assigns block model node values that represent the distance to the closest fracture intersection. Due to the huge amount of possible "beta" intersections, this algorithm can be very slow. The resolution of the model also determines the "granularity" of the intersection computations.These models can become very important when performing geotechnical analyses (tunneling, fluid flow, mineralization, etc.).
-
- Negate Node Values: Fracture models represent distance-to-fractures, so sometimes you'll be looking for high values (long distances to fractures representing stable areas) and sometimes you'll be looking for low values (short distances to fractures, for material movement).
- Leaving this setting OFF will result in close-fracture areas being at the bottom of the model's scale (low values) and distant-from-fracture areas being at the top of the model's scale (high values).
- The Negate Node Values option basically switches the scale around by multiplying the distance values by -1, so that low-valued/close-to-fracture areas now plot at the top of the scale. This can be particularly handy when displaying isosurface models of fracture proximities in RockPlot3D, and you really want to see close-to-fracture zones. Note, however, that with Negate Node Values turned on, you'll get negative distance values.
- Consider the following diagram of a solid fracture model, generated with Negate Node Values turned on, and shown with the isosurface filtered to show only high values. These represent close-to-fracture zones.
- Dimensions: Click here to establish the output dimensions (and node density) of the Fracture model. Unless there's a specific reason to do otherwise, you should probably leave the solid model dimensions set to the current project dimensions. (More info)
- Smoothing: Insert a check here to smooth the solid model G values based on a filter size and number of iterations. This can generally create a smoother, less "noisy" model. (More info)
- Use Existing Model: Click in this radio button if you wish to use an already-existing solid model of your fracture data.
- Solid Model: Click to the right to browse for the name of the existing solid model (.RwMod file) to be used for this 3D display.
- 3D Solid Diagram
Insert a check here to display the new or existing solid model as a 3D diagram.
Click this tab to establish the diagram options.
- Block Diagram
- Isosurface: Click in the Isosurface radio button to display the solid model as if enclosed in a "skin." This view will be smoother than a voxel display. (More info)
- Isomesh: Check this box to plot a series of polylines that represent three-dimensional contours at a user-defined cutoff. Click this tab to establish the settings. (More info)
- Voxels: Click in the Voxels radio button to represent the solid model in the 3D display as color-coded voxels. You can choose to display either the Full Voxel, or just the Midpoint. Display of the midpoint only can significantly improve display time for huge models.
- Filter: Check this option if you want to restrict the isosurface or voxel display to a specific data range. This does not affect the model, only the display of the model. Enabling this permits you to create an initial display in RockPlot3D that eliminates the need to manually change the display attributes. More importantly, this capability if essential for initially displaying the solid in a pre-filtered state when creating animations and Playlist scripts.
! These filter settings can be changed once the diagram is displayed in RockPlot3D.
- Color Scheme: Choose the color scheme for the block model - automatic, table-based, etc. (More info)
- Other 3D Diagram Options
Use these checkboxes to append other layers to your 3D scene.
Click each tab to set up the 3D diagram layers (images, infrastructure, reference cage, etc.).
! If you are including Striplogs, be sure to click on the 3D Log Design button at the top of the window to define the log appearance.
- Output Options: Use these settings to define whether the output scene is to be saved (or displayed as "untitled"), how the file should be named, and whether it is to be displayed after it is created. It also offers export options. (More info)
- Access the RockWorks Datasheet program tab.
- Open or import the fracture data. See Exporting Fracture Data to the Datasheet for information about the data structure.
- Select the ModOps | Solid | Create | Fractures->Solid menu option.
- Enter the requested menu settings, described above.
- Click the Continue button to proceed.
The program will read the location and orientation information for all of the fractures. It will use a unique modeling algorithm to determine the distance from each node to the closest point on the closest fracture disk, or to the closest fracture intersection, as requested. If you have requested "Negate Values" then the distances will be multiplied by "-1" so that large distances will become very large negative numbers, and easier to filter from the display in RockPlot3D.
If you requested a diagram, the model will be displayed in a RockPlot3D tab in the Options window, using the using the requested display settings.
- You can adjust any of the modeling and/or display settings via the Options tab to the left, and then click the Continue button again to regenerate the display.
- View / manipulate the image in RockPlot3D.

RockWare home page