Faults | Display | 2D Map
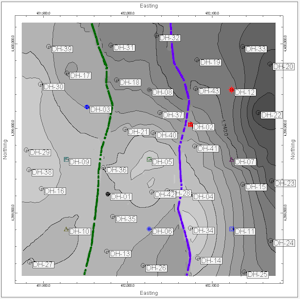
This program creates a 2D map of the enabled faults in the Faults table. For 3D faults, you can choose to plot all triangles projected onto the map, or simply a polyline representing the intersection of the fault with a specific surface (.RwGrd file) or elevation. 2D faults are vertical and are always represented as a polyline. The line style and color for each fault polyline are defined in the Faults tab.
This map uses the same settings as the Faults layer in most other 2D maps in RockWorks.
See also:
Display Active Faults in a 3D Diagram
Menu Options
Step-by-Step Summary
- Projection: Select how the faults are to be displayed in the map.
- 3D Fault Settings: See Fault Polyline Options for more information.
- Plot All Fault Triangles: The outline of each triangle is projected onto the 2D map.
- Plot Intersections of Faults & Horizontal Plane: Enter a Horizontal Plane Elevation. The program will plot the intersection of each active fault and the plane as a polyline.
- Plot Intersections of Faults & Grid Model: Select an existing RwGrd file. The program will plot the intersection of each active fault and the RwGrd file as a polyline.
- 2D & 3D Fault Settings
- Polyline Smoothing Factor: Use this setting to force RockWorks to apply smoothing to the fault polyline. You can request 1, 2, or more smoothing passes. For no smoothing, set this to 0.
- Plot Fault Titles: Check this box if the name of the fault is to be included in the fault polyline. The fault names are defined in the Faults tab. See Fault Polyline Options for more information.
- Plot Symbols: Check this option if you have defined symbols for the fault and they are to be displayed here. The type of symbol to be displayed (such as hatchures, triangles, or custom symbols) are defined in the Faults tab. See Fault Polyline Options for more information.
- Other map layers:
- Background Image
Check this option to display an image behind the other map layers. You can select your project image or another raster map.
Click on this tab to establish the background-bitmap settings. (More info)
- Labeled Axes
Check this option to annotate the map borders with axis titles and/or coordinate labels.
Click on this tab to establish the map axis settings. (More info).
- Map Overlays
Check this option to include various other layers on your map. Options incude Infrastructure maps, US Public Land Grid maps, Polygon outlines, and more.
Click on this tab to activate the different layers and establish their settings. (More info)
- Other 2D Files
Check this option to include existing RockWorks maps as layers with your map. For example, if you have a land grid map already created for your project, you can include that as a layer here.
Click on this tab to select the existing maps (.Rw2D files) to be included. (More info)
- Peripherals
Check this option to include various map peripheral annotations with your map. Options include titles, north arrows, scalebars, and more.
Click on this tab to activate the items and establish their settings. (More info)
- Border
Check this option to include a solid line border around the entire map image.
Click on this tab to specify the line style, thickness, and color.
- Output Options: Use these settings to define whether the output graphic is to be saved (or displayed as "untitled"), how the file should be named, and whether it is to be displayed after it is created. It also offers export options. (More info)
- Access the Faults program tab.
- Be sure the faults to be processed are enabled (shown with a check-mark).
- Select the Display | 2D Map menu option.
- Enter the requested menu settings, described above.
- Click the Continue button to proceed.
RockWorks will read the triangle coordinates from the enabled faults in the Faults table. It will generate a map showing all of the triangles or the fault intersection with a plane or grid model, as requested. Other map layers will be appended as requested. The resulting map will be displayed in a RockPlot2D tab in the program window.
- You can adjust any of the settings in the Options tab to the left and click the Continue button again to regenerate the map.
- View / save / manipulate / print / append / export the map in the RockPlot2D window.
 Back to Faults Program Tab

RockWare home page