Faults | Display | 3D Diagram
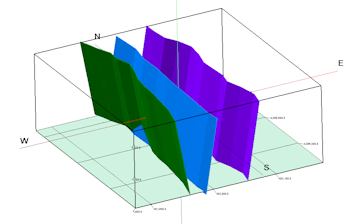
This program reads the active faults in the Faults tab and displays them as a 3D diagram comprised of a triangle mesh and/or a polyline where they intersect a grid surface.
This map uses the same settings as the Faults layer in most other 3D diagrams in RockWorks.
See also:
Display Active Faults in a 2D Map
Menu Options
Step-by-Step Summary
- 3D Log Design
If you decide to include logs with this diagram (via the "Striplogs" setting), click on this tab at the top of the window to set up how you want the 3D logs to look.
See Visible Item Summary and Using the 3D Log Designer for details.
- Appearance: Click this tab to establish diagram settings.
- Plot Faults as 3D Triangle Meshes: Check this box to display the fault(s) as 3D triangles. You can activate both this and the polylines, below.
- Plot Triangle Perimeters: If you have requested 3D triangle mesh display, you can check this box if the outlines of each triangle comprising the ribbon are to be displayed. The perimeter color will correspond to the color defined for the fault in the table.
- Fill Triangles within Fault Mesh: Check this option to fill the triangles with the fault color.
- Triangle Thickness: Specify the thickness of the solid triangles in project units.
-
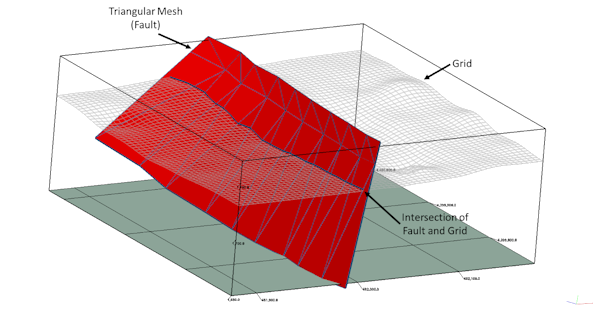
- Plot Fault / Grid Intersections as Lines: Check this option to plot a 3D line at the intersection of the Fault Surface and an RwGrd file.
- Grid: Browse for the name of the RwGrd file.
- Vertical Offset: Enter a vertical offset value, in your project units, to offset the line above or below the actual intersection line, for visibility.
- Other 3D Diagram Options
Use these checkboxes to append other layers to your 3D scene.
Click each tab to set up the 3D diagram layers (images, infrastructure, reference cage, etc.).
! If you are including Striplogs, be sure to click on the 3D Log Design tab at the top of the window to define the log appearance.
- Access the Faults program tab.
- Be sure the faults to be visualized are enabled (shown with a check-mark).
- Select the Display | 3D Diagram menu option.
- Enter the requested menu settings, described above.
- Click the Continue button to proceed.
RockWorks will read the selected faults and create the requested triangle mesh(s) and/or grid intersection polyline(s) for display in a RockPlot3D tab.
- You can click on the Options tab to the left to return to the diagram settings, then click Continue again to create a new display.
- View / save / manipulate / print the diagram in the RockPlot3D window.
 Back to Faults Program Tab

RockWare home page